
 E-mail Alert
 RSS
RSS
-
摘要
随着点云数据在虚拟现实、计算机视觉、机器人等领域中的广泛应用,点云获取与处理中的失真评价正成为一个重要的研究问题。考虑到点云三维信息对几何失真敏感、点云二维投影图包含丰富的纹理和语义信息,提出一种基于三维与二维特征融合的无参考点云质量评价方法,以有效结合点云的三维与二维特征信息,提高点云质量评价的准确性。对于三维特征提取,先对点云进行最远点采样,以选取的点为中心生成互不重叠的点云子模型,尽可能地覆盖整个点云模型,利用多尺度三维特征提取网络提取体素和点的特征。对于二维特征提取,先对点云进行正交6面投影,再通过多尺度二维特征提取网络提取纹理和语义信息。最后,考虑到人类视觉系统处理不同类型信息时会存在分割处理和交织融合的过程,设计一个对称跨模态注意模块融合三维和二维特征。在5个公开点云质量评价数据库上的实验结果显示,所提方法的皮尔逊线性相关系数(Pearson’s linear correlation coefficient,PLCC)分别达到
0.9203 、0.9463 、0.9125 、0.916和0.921,表明与现有的代表性点云质量评价方法相比,所提方法更优。Abstract
With the wide application of point clouds in virtual reality, computer vision, robotics and other fields, the assessment of distortions resulted from point cloud acquisition and processing is becoming an important research topic. Considering that the three-dimensional information of point clouds is sensitive to geometric distortion and the two-dimensional projection of point clouds contains rich texture and semantic information, a no-reference point cloud quality assessment method based on the fusion of three-dimensional and two-dimensional features is proposed to effectively combine the three-dimensional and two-dimensional feature information of point cloud and improve the accuracy of point cloud quality assessment. For 3D feature extraction, the farthest point sampling is firstly implemented on the point cloud, and then the non-overlapping point cloud sub-models centered on the selected points are generated, to cover the whole point cloud model as much as possible and use a multi-scale 3D feature extraction network to extract the features of voxels and points. For 2D feature extraction, the point cloud is first projected with orthogonal hexahedron projection, and then the texture and semantic information are extracted by a multi-scale 2D feature extraction network. Finally, considering the process of segmentation and interweaving fusion that occurs when the human visual system processes different types of information, a symmetric cross-modal attention module is designed to integrate 3D and 2D features. The experimental results on five public point cloud quality assessment datasets show that the Pearson’s linear correlation coefficient (PLCC) of the proposed method reaches 0.9203, 0.9463, 0.9125, 0.9164 and 0.9209 respectively, indicating that the proposed method has advanced performance compared with the existing representative point cloud quality assessment methods.
-
Overview
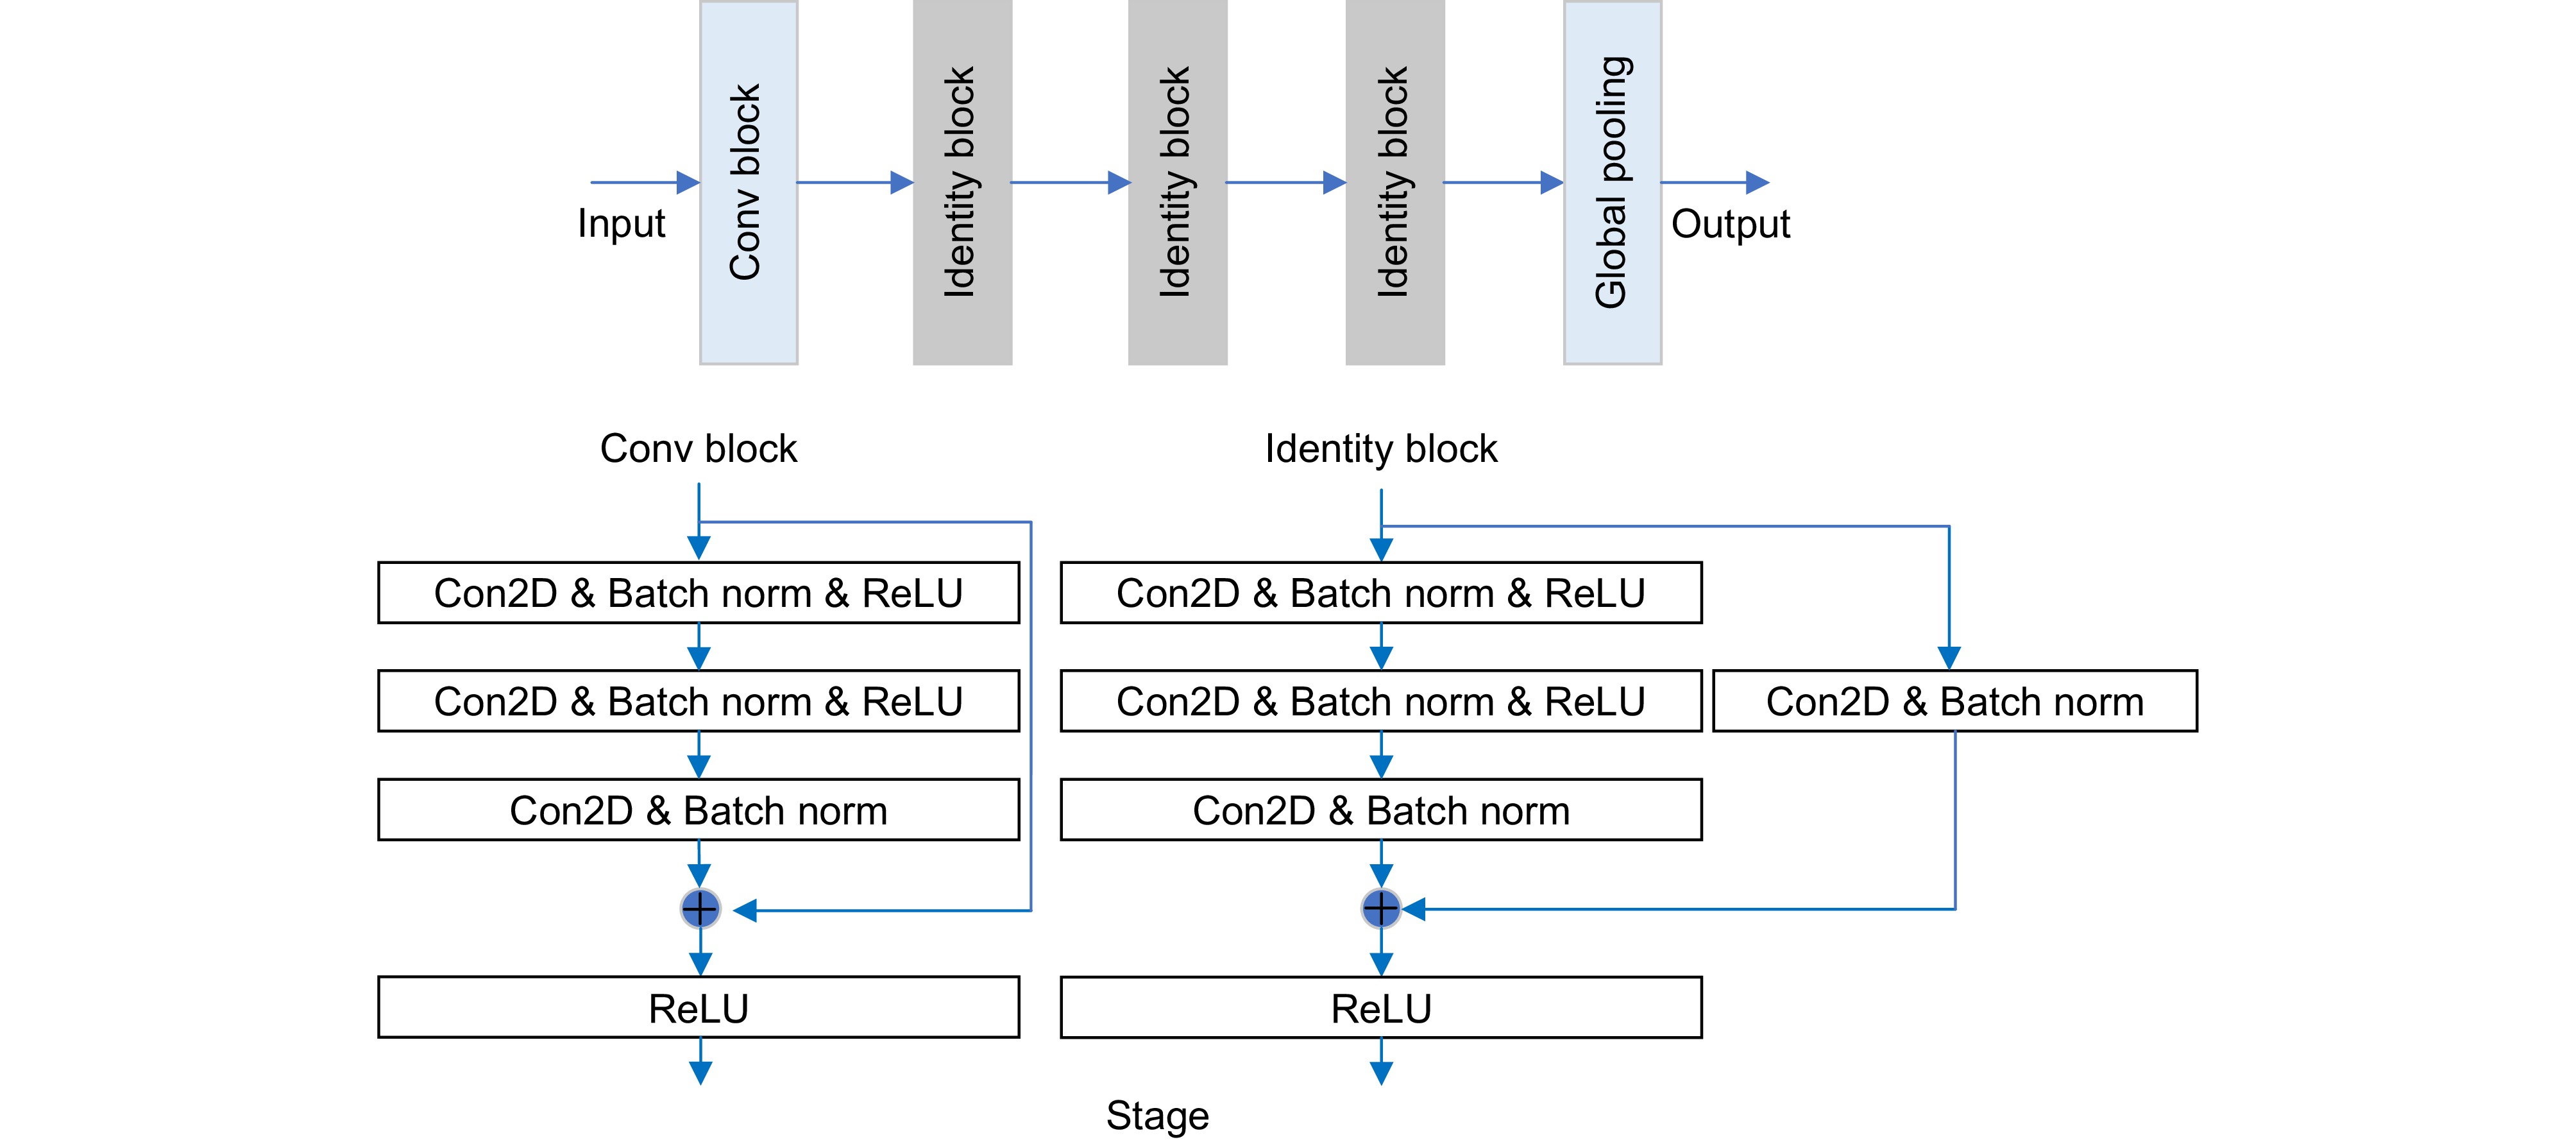
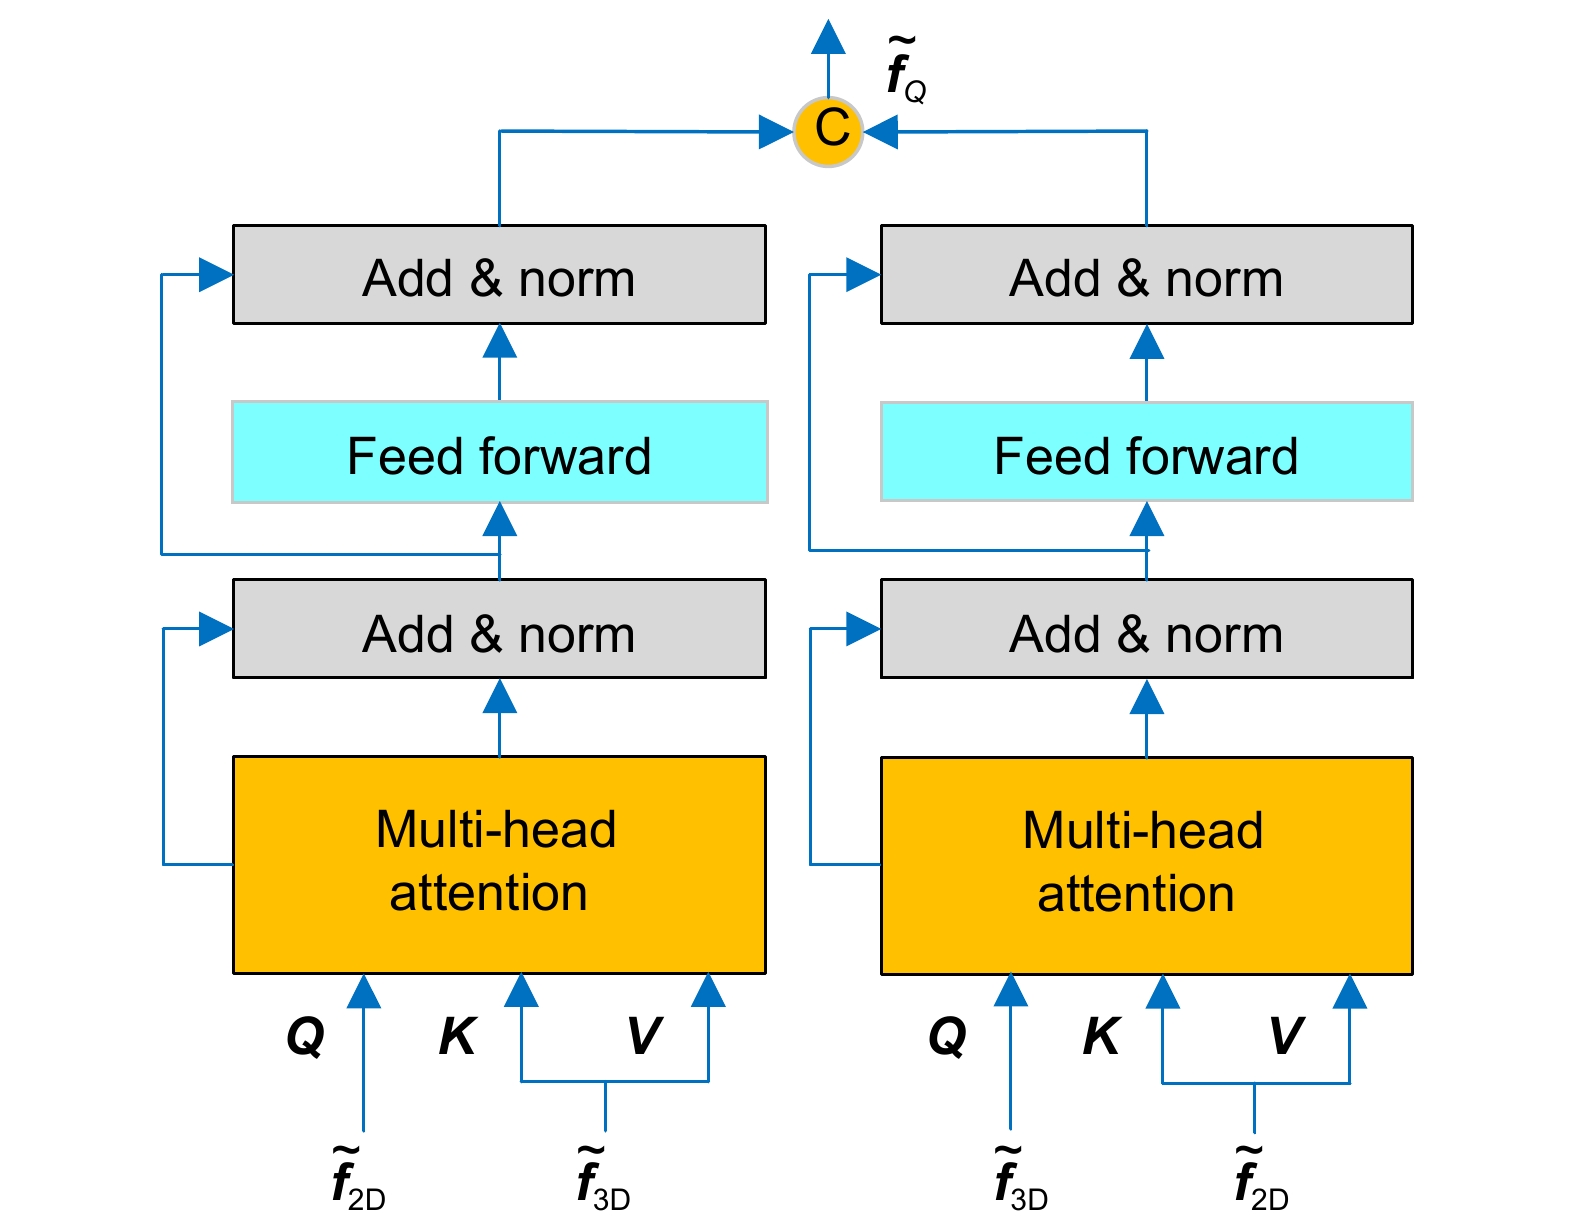
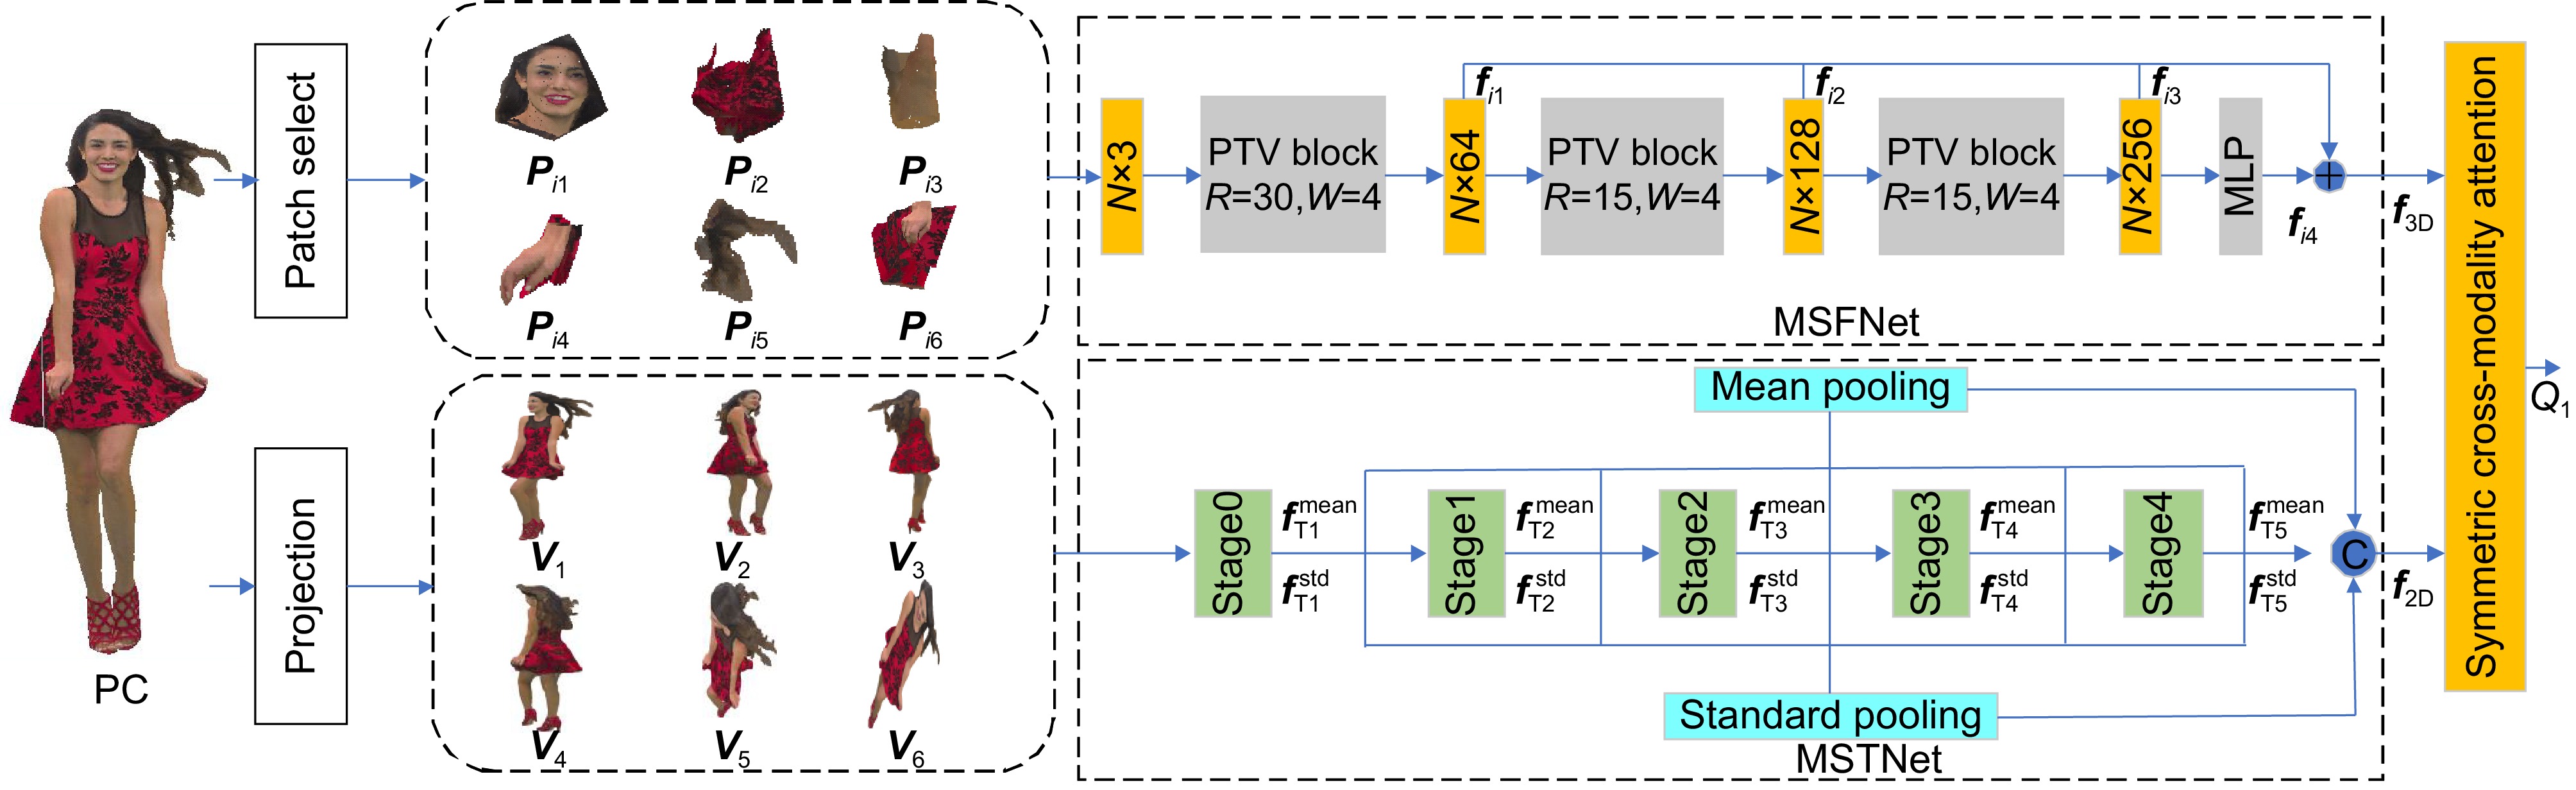
Overview: Point clouds are widely used in virtual reality, computer vision, robotics and other fields, and distortion assessment in point cloud acquisition and processing is becoming an important research topic. Considering that the three-dimensional (3D) information of point cloud is sensitive to geometric distortion and the two-dimensional (2D) projection of point cloud contains rich texture and semantic information, this paper proposes a no-reference point cloud quality assessment method to effectively combine the 3D and 2D feature information of point cloud and improve the accuracy of quality assessment. The farthest point sampling is firstly implemented on the point cloud, and then the non-overlapping point cloud sub-models centered on the selected points are generated, to cover the whole point cloud model as much as possible. For each point cloud sub-model, an improved 3D multi-scale feature extraction network (MSFNet) is designed to extract the features of voxels and points. MSFNet contains three point-voxel transformer (PVT) modules and generates output features through a multilayer perceptron. Each PVT module has two branches. The voxel branch can extract rich semantic features from spatial voxels; the point-based branch can retain the integrity of the point cloud sub-model position information as much as possible and avoid the loss of position information. For 2D feature extraction, the point cloud is first projected with orthogonal hexahedron projection to obtain the corresponding projection maps. To extract the rich texture and semantic information from the 2D projection maps, a 2D multi-scale feature extraction network (MSTNet) is designed to extract 2D content-aware features. Considering that there may be a large amount of redundant information and certain dependency relationships between different viewpoint projection maps, MSTNet uses spatial global average pooling operation to remove redundant information and spatial global standard deviation pooling operation to preserve the dependency information between different viewpoint projection maps. Finally, considering the process of segmentation and interweaving fusion that occurs when the human visual system processes different modality information, to better fuse the 2D and 3D features of the point cloud, so that the two modality features can enhance each other, a symmetric cross-modality attention module is designed to integrate the 3D and 2D features, and a multi-head attention mechanism is added in the feature fusion process. The experimental results on five public point cloud quality assessment datasets show that the Pearson's linear correlation coefficient (PLCC) of the proposed method reaches 0.9203, 0.9463, 0.9125, 0.9164, and 0.9209, respectively, indicating that the proposed method has advanced performance compared with the existing representative point cloud quality assessment methods.
-

-
表 1 不同方法在不同数据库上的总体性能对比
Table 1. Comparison of overall performance of different methods on different datasets
Type Metric CPCD2.0 SJTU-PCQA IRPC PLCC SROCC KROCC RMSE PLCC SROCC KROCC RMSE PLCC SROCC KROCC RMSE Full-reference P2point_MSE[3] 0.6784 0.5491 0.4142 0.8617 0.4721 0.4096 0.2857 2.1394 0.3357 0.3281 0.2146 0.9313 P2plane_Hausdorff[4] 0.4061 0.3786 0.2663 1.0718 0.3752 0.4609 0.3354 2.4467 0.3925 0.2541 0.1975 0.9089 P2plane_MSE[4] 0.6914 0.5692 0.4385 0.8474 0.5651 0.4956 0.3514 2.0022 0.4296 0.2564 0.1957 0.9089 PC-MSDM[10] 0.6254 0.5321 0.3842 0.9152 0.4123 0.3241 0.2189 2.2110 0.2729 0.1519 0.1063 0.9515 PointSSIM-G[13] 0.5343 0.5533 0.4238 0.9915 0.3860 0.3649 0.2792 2.2410 0.6183 0.5951 0.4693 0.7760 PointSSIM-C[13] 0.7457 0.6891 0.4863 0.7814 0.4561 0.4185 0.3172 2.1598 0.6648 0.5638 0.4211 0.7376 PCQM[11] 0.4813 0.3408 0.2615 1.0281 0.7771 0.7420 0.5624 1.5274 0.5611 0.5611 0.3033 0.8184 GraphSIM[12] 0.8553 0.8296 0.6234 0.6077 0.8900 0.8800 - 1.1300 0.9400 0.7600 - 0.2100 No-reference BEQ-CVP[14] 0.7950 0.7890 0.5983 0.7218 0.9192 0.8972 0.7343 0.9717 0.7265 0.7298 0.5427 0.6586 IW-SSIM[15] - - - - 0.7949 0.7833 - - 0.0911 0.1339 - - MFPCQA[16] - - - - 0.8972 0.8894 - 0.6488 - - - - Proposed 0.9203 0.8996 0.7494 0.4195 0.9463 0.9248 0.8231 0.3854 0.9125 0.8566 0.7018 0.4529  下载: 导出CSV
表 2 不同方法在不同数据库上的总体性能对比
Table 2. Comparison of overall performance of different methods on different datasets
Type Metric CPCD2.0 subset ICIP2020 M-PCCD PLCC SROCC KROCC RMSE PLCC SROCC KROCC RMSE PLCC SROCC KROCC RMSE No-reference PRPCQA[17] 0.8591 0.8351 0.7014 0.5581 0.9310 0.9307 0.8814 0.3011 0.9144 0.9241 0.6857 0.5107 VPPCQA[21] 0.8343 0.8460 0.6578 0.6046 0.9114 0.9264 0.8311 0.3965 0.9147 0.9322 0.6923 0.4903 Proposed 0.9100 0.8842 0.7348 0.4371 0.9160 0.8827 0.8564 0.3672 0.9215 0.9400 0.7638 0.4720
下载: 导出CSV
表 3 CPCD2.0数据集上不同特征的性能对比
Table 3. Performance comparison of different features on CPCD2.0 dataset
$ \boldsymbol{f}_{2\mathrm{D}} $ $ \boldsymbol{f}_{3\mathrm{D}} $ PLCC SROCC KROCC RMSE √ 0.9096 0.8879 0.6792 0.4391 √ 0.5148 0.4754 0.5148 0.9596 √ √ 0.9203 0.8996 0.7494 0.4195
下载: 导出CSV
表 4 采用不同特征融合方法的性能对比
Table 4. Performance comparison of different feature fusion methods
Method PLCC SROCC KROCC RMSE Add 0.8985 0.8757 0.7163 0.4626 Concat 0.9141 0.8914 0.7370 0.4236 SCMA 0.9203 0.8996 0.7494 0.4195
下载: 导出CSV
表 5 点云子模型数量及其包含点数对所提方法性能的影响
Table 5. The impact of the number of point cloud sub-models and their inclusion points on the performance of the proposed method
Parameter PLCC SROCC KROCC RMSE 48×256 0.9060 0.8847 0.7327 0.4495 24×512 0.9049 0.8902 0.7249 0.4557 12×1024 0.8821 0.8607 0.6949 0.4993 6×2048 0.9203 0.8996 0.7494 0.4195
下载: 导出CSV
表 6 不同点云子模型中心点生成方法的性能对比
Table 6. Performance comparison of different center point generation methods for point cloud sub-models
Sampling method PLCC SROCC KROCC RMSE Random sampling 0.8427 0.8236 0.7129 0.4572 Cell sampling 0.8668 0.7707 0.7018 0.4327 Geometric sampling 0.8643 0.8695 0.6821 0.4311 Farthest point sampling 0.9203 0.8996 0.7494 0.4195
下载: 导出CSV
表 7 不同点云patch数量的性能对比
Table 7. Performance comparison of the number of different cloud points' patch
Patch number PLCC SROCC KROCC RMSE 2 0.8321 0.8014 0.6929 0.4723 4 0.8718 0.8207 0.7381 0.4532 6 0.9203 0.8996 0.7494 0.4195 8 0.9000 0.8712 0.7301 0.4330
下载: 导出CSV
-
参考文献
[1] 陶志勇, 李衡, 豆淼森, 等. 融合多分辨率特征的点云分类与分割网络[J]. 光电工程, 2023, 50(10): 230166. doi: 10.12086/oee.2023.230166
Tao Z Y, Li H, Dou M S, et al. Multi-resolution feature fusion for point cloud classification and segmentation network[J]. Opto-Electron Eng, 2023, 50(10): 230166. doi: 10.12086/oee.2023.230166
[2] Gao W, Sun S, Zheng H, et al. OpenDMC: an open-source library and performance evaluation for deep-learning-based multi-frame compression[C]. Proceedings of the 31st ACM International Conference on Multimedia, 2023: 9685-9688
[3] Mekuria R N, Li Z, Tulvan C, et al. Evaluation criteria for PCC (point cloud compression)[J]. ISO/IEC JTC, 2016, 1: N16332.
[4] Tian D, Ochimizu H, Feng C, et al. Geometric distortion metrics for point cloud compression[C]//2017 IEEE International Conference on Image Processing (ICIP), 2017: 3460–3464. https://doi.org/10.1109/ICIP.2017.8296925.
[5] Cignoni P, Rocchini C, Scopigno R. Metro: measuring error on simplified surfaces[J]. Comput Graph Forum, 1998, 17(2): 167−174. doi: 10.1111/1467-8659.00236
[6] Alexiou E, Ebrahimi T. Point cloud quality assessment metric based on angular similarity[C]//2018 IEEE International Conference on Multimedia and Expo (ICME), 2018: 1–6. https://doi.org/10.1109/ICME.2018.8486512.
[7] Javaheri A, Brites C, Pereira F, et al. Improving psnr-based quality metrics performance for point cloud geometry[C]//2020 IEEE International Conference on Image Processing, 2020: 3438–3442. https://doi.org/10.1109/ICIP40778.2020.9191233.
[8] Javaheri A, Brites C, Pereira F, et al. A generalized Hausdorff distance based quality metric for point cloud geometry[C]//2020 Twelfth International Conference on Quality of Multimedia Experience, 2020: 1–6. https://doi.org/10.1109/QoMEX48832.2020.9123087.
[9] Javaheri A, Brites C, Pereira F, et al. Mahalanobis based point to distribution metric for point cloud geometry quality evaluation[J]. IEEE Signal Process Lett, 2020, 27: 1350−1354. doi: 10.1109/LSP.2020.3010128
[10] Meynet G, Digne J, Lavoué G. PC-MSDM: a quality metric for 3D point clouds[C]//2019 Eleventh International Conference on Quality of Multimedia Experience (QoMEX), 2019: 1–3. https://doi.org/10.1109/QoMEX.2019.8743313.
[11] Meynet G, Nehmé Y, Digne J, et al. PCQM: a full-reference quality metric for colored 3D point clouds[C]//2020 Twelfth International Conference on Quality of Multimedia Experience (QoMEX), 2020: 1–6. https://doi.org/10.1109/QoMEX48832.2020.9123147.
[12] Yang Q, Ma Z, Xu Y L, et al. Inferring point cloud quality via graph similarity[J]. IEEE Trans Pattern Anal Mach Intell, 2020, 44(6): 3015−3029. doi: 10.1109/TPAMI.2020.3047083
[13] Alexiou E, Ebrahimi T. Towards a point cloud structural similarity metric[C]//2020 IEEE International Conference on Multimedia & Expo Workshops (ICMEW), 2020: 1–6. https://doi.org/10.1109/ICMEW46912.2020.9106005.
[14] Hua L, Jiang G Y, Yu M, et al. BQE-CVP: blind quality evaluator for colored point cloud based on visual perception[C]//2021 IEEE International Symposium on Broadband Multimedia Systems and Broadcasting (BMSB), 2021: 1–6. https://doi.org/10.1109/BMSB53066.2021.9547070.
[15] Liu Q, Su H L, Duanmu Z F, et al. Perceptual quality assessment of colored 3D point clouds[J]. IEEE Trans Vis Comput Graph, 2023, 29(8): 3642−3655. doi: 10.1109/TVCG.2022.3167151
[16] Lv J Y, Su H L, Long J C, et al. Point cloud quality assessment using multi-level features[J]. IEEE Access, 2024, 12: 47755−47767. doi: 10.1109/ACCESS.2024.3383536
[17] Tu R W, Jiang G Y, Yu M, et al. Pseudo-reference point cloud quality measurement based on joint 2-D and 3-D distortion description[J]. IEEE Trans Instrum Meas, 2023, 72: 5019314. doi: 10.1109/TIM.2023.3290291
[18] Liu Q, Yuan H, Su H L, et al. PQA-Net: deep no reference point cloud quality assessment via multi-view projection[J]. IEEE Trans Circuits Syst Video Technol, 2021, 31(12): 4645−4660. doi: 10.1109/TCSVT.2021.3100282
[19] Yang Q, Liu Y P, Chen S H, et al. No-reference point cloud quality assessment via domain adaptation[C]//Proceedings of the 2022 IEEE/CVF Conference on Computer Vision and Pattern Recognition, 2022: 21147–21156. https://doi.org/10.1109/CVPR52688.2022.02050.
[20] Tao W X, Jiang G Y, Jiang Z D, et al. Point cloud projection and multi-scale feature fusion network based blind quality assessment for colored point clouds[C]//Proceedings of the 29th ACM International Conference on Multimedia, 2021: 5266–5272. https://doi.org/10.1145/3474085.3475645.
[21] Tu R W, Jiang G Y, Yu M, et al. V-PCC projection based blind point cloud quality assessment for compression distortion[J]. IEEE Trans Emerg Top Comput Intell, 2023, 7(2): 462−473. doi: 10.1109/TETCI.2022.3201619
[22] Tliba M, Chetouani A, Valenzise G, et al. PCQA-graphpoint: efficient deep-based graph metric for point cloud quality assessment[C]//ICASSP 2023 - 2023 IEEE International Conference on Acoustics, Speech and Signal Processing (ICASSP), 2023: 1–5. https://doi.org/10.1109/ICASSP49357.2023.10096610.
[23] Qi C R, Yi L, Su H, et al. PointNet++: deep hierarchical feature learning on point sets in a metric space[C]. Proceedings of the 31st International Conference on Neural Information Processing Systems, 2017: 5105–5114.
[24] Dodge S, Karam L. Understanding how image quality affects deep neural networks[C]//2016 Eighth International Conference on Quality of Multimedia Experience (QoMEX), 2016: 1–6. https://doi.org/10.1109/QoMEX.2016.7498955.
[25] He Z Y, Jiang G Y, Yu M, et al. TGP-PCQA: texture and geometry projection based quality assessment for colored point clouds[J]. J Vis Commun Image Represent, 2022, 83: 103449. doi: 10.1016/j.jvcir.2022.103449
[26] Yang Q, Chen H, Ma Z, et al. Predicting the perceptual quality of point cloud: a 3D-to-2D projection-based exploration[J]. IEEE Trans Multimedia, 2021, 23: 3877−3891. doi: 10.1109/TMM.2020.3033117
[27] Javaheri A, Brites C, Pereira F, et al. Point cloud rendering after coding: impacts on subjective and objective quality[J]. IEEE Trans Multimedia, 2021, 23: 4049–4064. https://doi.org/10.1109/TMM.2020.3037481.
[28] Perry S, Cong H P, da Silva Cruz L A, et al. Quality evaluation of static point clouds encoded using MPEG codecs[C]//2020 IEEE International Conference on Image Processing (ICIP), 2020: 3428–3432. https://doi.org/10.1109/ICIP40778.2020.9191308.
[29] Alexiou E, Viola I, Borges T M, et al. A comprehensive study of the rate-distortion performance in MPEG point cloud compression[J]. APSIPA Trans Signal Inf Process, 2019, 8(1): e27. doi: 10.1017/ATSIP.2019.20
-
访问统计

 点击扫一扫
点击扫一扫

图(5)
表(7)
计量
- 文章访问数:
- PDF下载数:
- 施引文献: 0


