
 E-mail Alert
 RSS
RSS
Multi-task attention mechanism based no reference quality assessment algorithm for screen content images
-
摘要
提出一种基于多任务注意力机制的无参考屏幕内容图像质量评价算法(multi-task attention mechanism based no reference quality assessment algorithm for screen content images, MTA-SCI)。MTA-SCI首先使用自注意力机制提取屏幕内容图像的全局特征,增强对屏幕内容图像整体信息的表征能力;然后使用综合局部注意力机制提取屏幕内容图像的局部特征,使局部特征能够聚焦于屏幕内容图像中更吸引人注意的细节部分;最后使用双通道特征映射模块预测屏幕内容图像的质量分数。在SCID和SIQAD数据集上,MTA-SCI的斯皮尔曼秩序相关系数(Spearman's rank order correlation coefficient, SRCC)分别达到0.9602和0.9233,皮尔森线性相关系数(Pearson linear correlation coefficient, PLCC)分别达到0.9609和0.9294。实验结果表明,MTA-SCI在预测屏幕内容图像质量任务中具有较高的准确性。
-
关键词:
- 屏幕内容图像 /
- 无参考图像质量评价 /
- vision transformer /
- 多级视觉感知特性 /
- 注意力机制
Abstract
This paper proposed a multi-task attention mechanism-based no-reference quality assessment algorithm for screen content images (MTA-SCI). The MTA-SCI first used a self-attention mechanism to extract global features from screen content images, enhancing the representation of overall image information. It then applied an integrated local attention mechanism to extract local features, allowing the focus to be on attention-grabbing details within the image. Finally, a dual-channel feature mapping module predicted the quality score of the screen content image. On the SCID and SIQAD datasets, MTA-SCI achieves Spearman's rank-order correlation coefficients (SROCC) of 0.9602 and 0.9233, and Pearson linear correlation coefficients (PLCC) of 0.9609 and 0.9294, respectively. The experimental results show that the MTA-SCI achieves high accuracy in predicting screen content image quality.
-
Overview
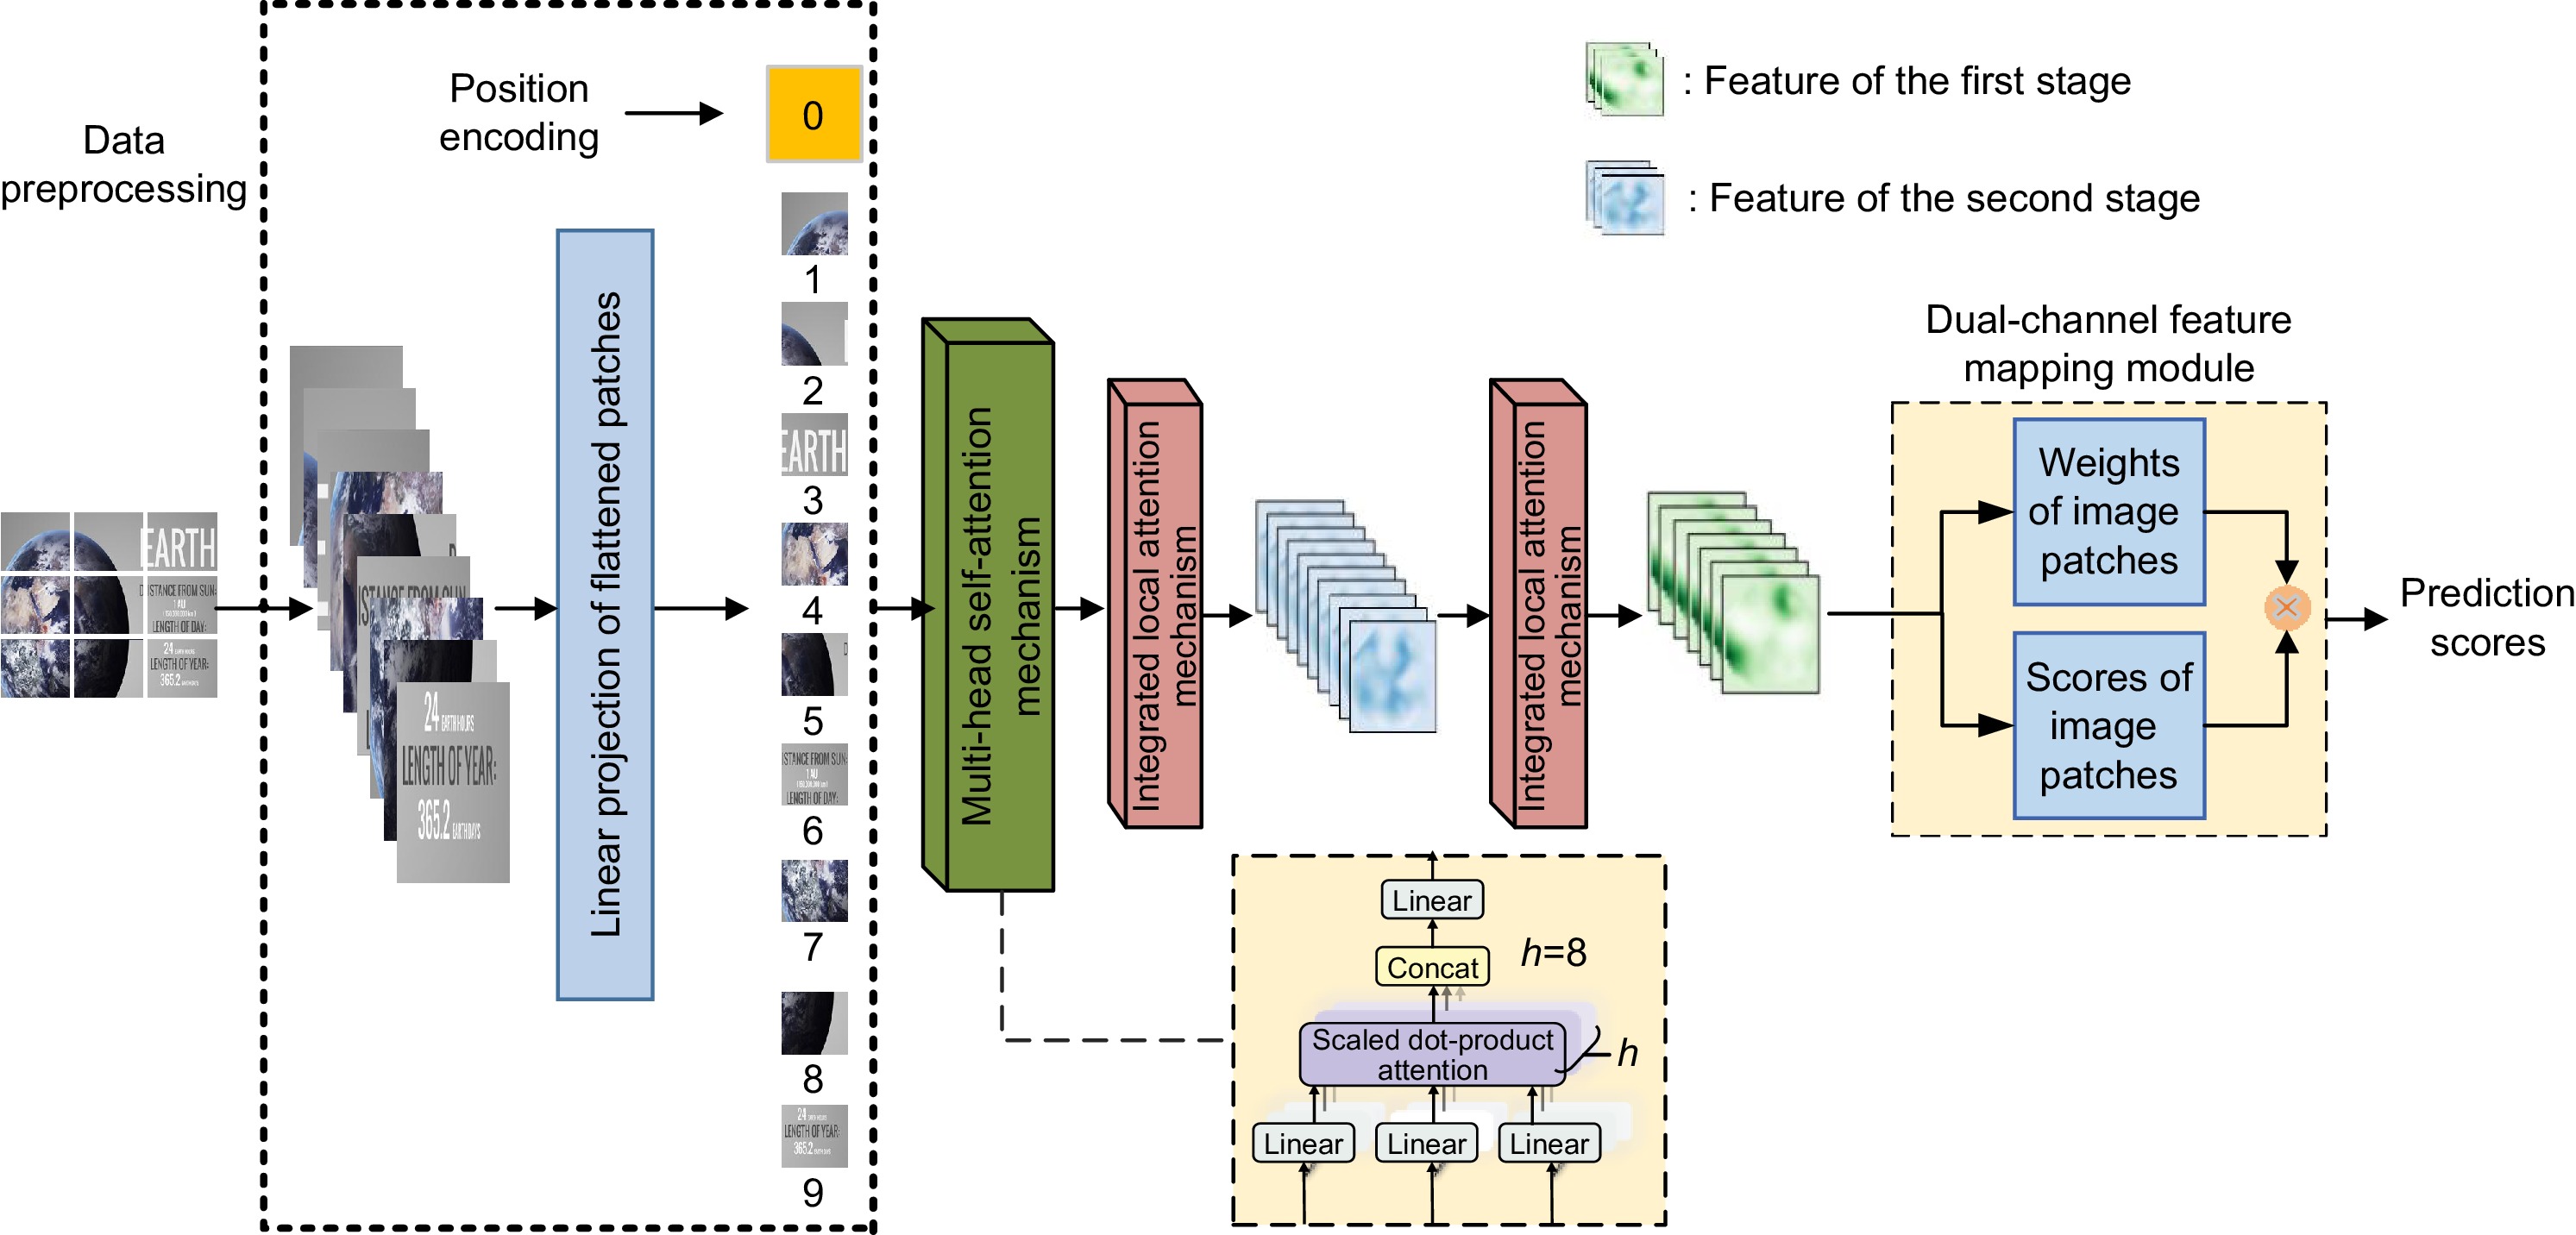
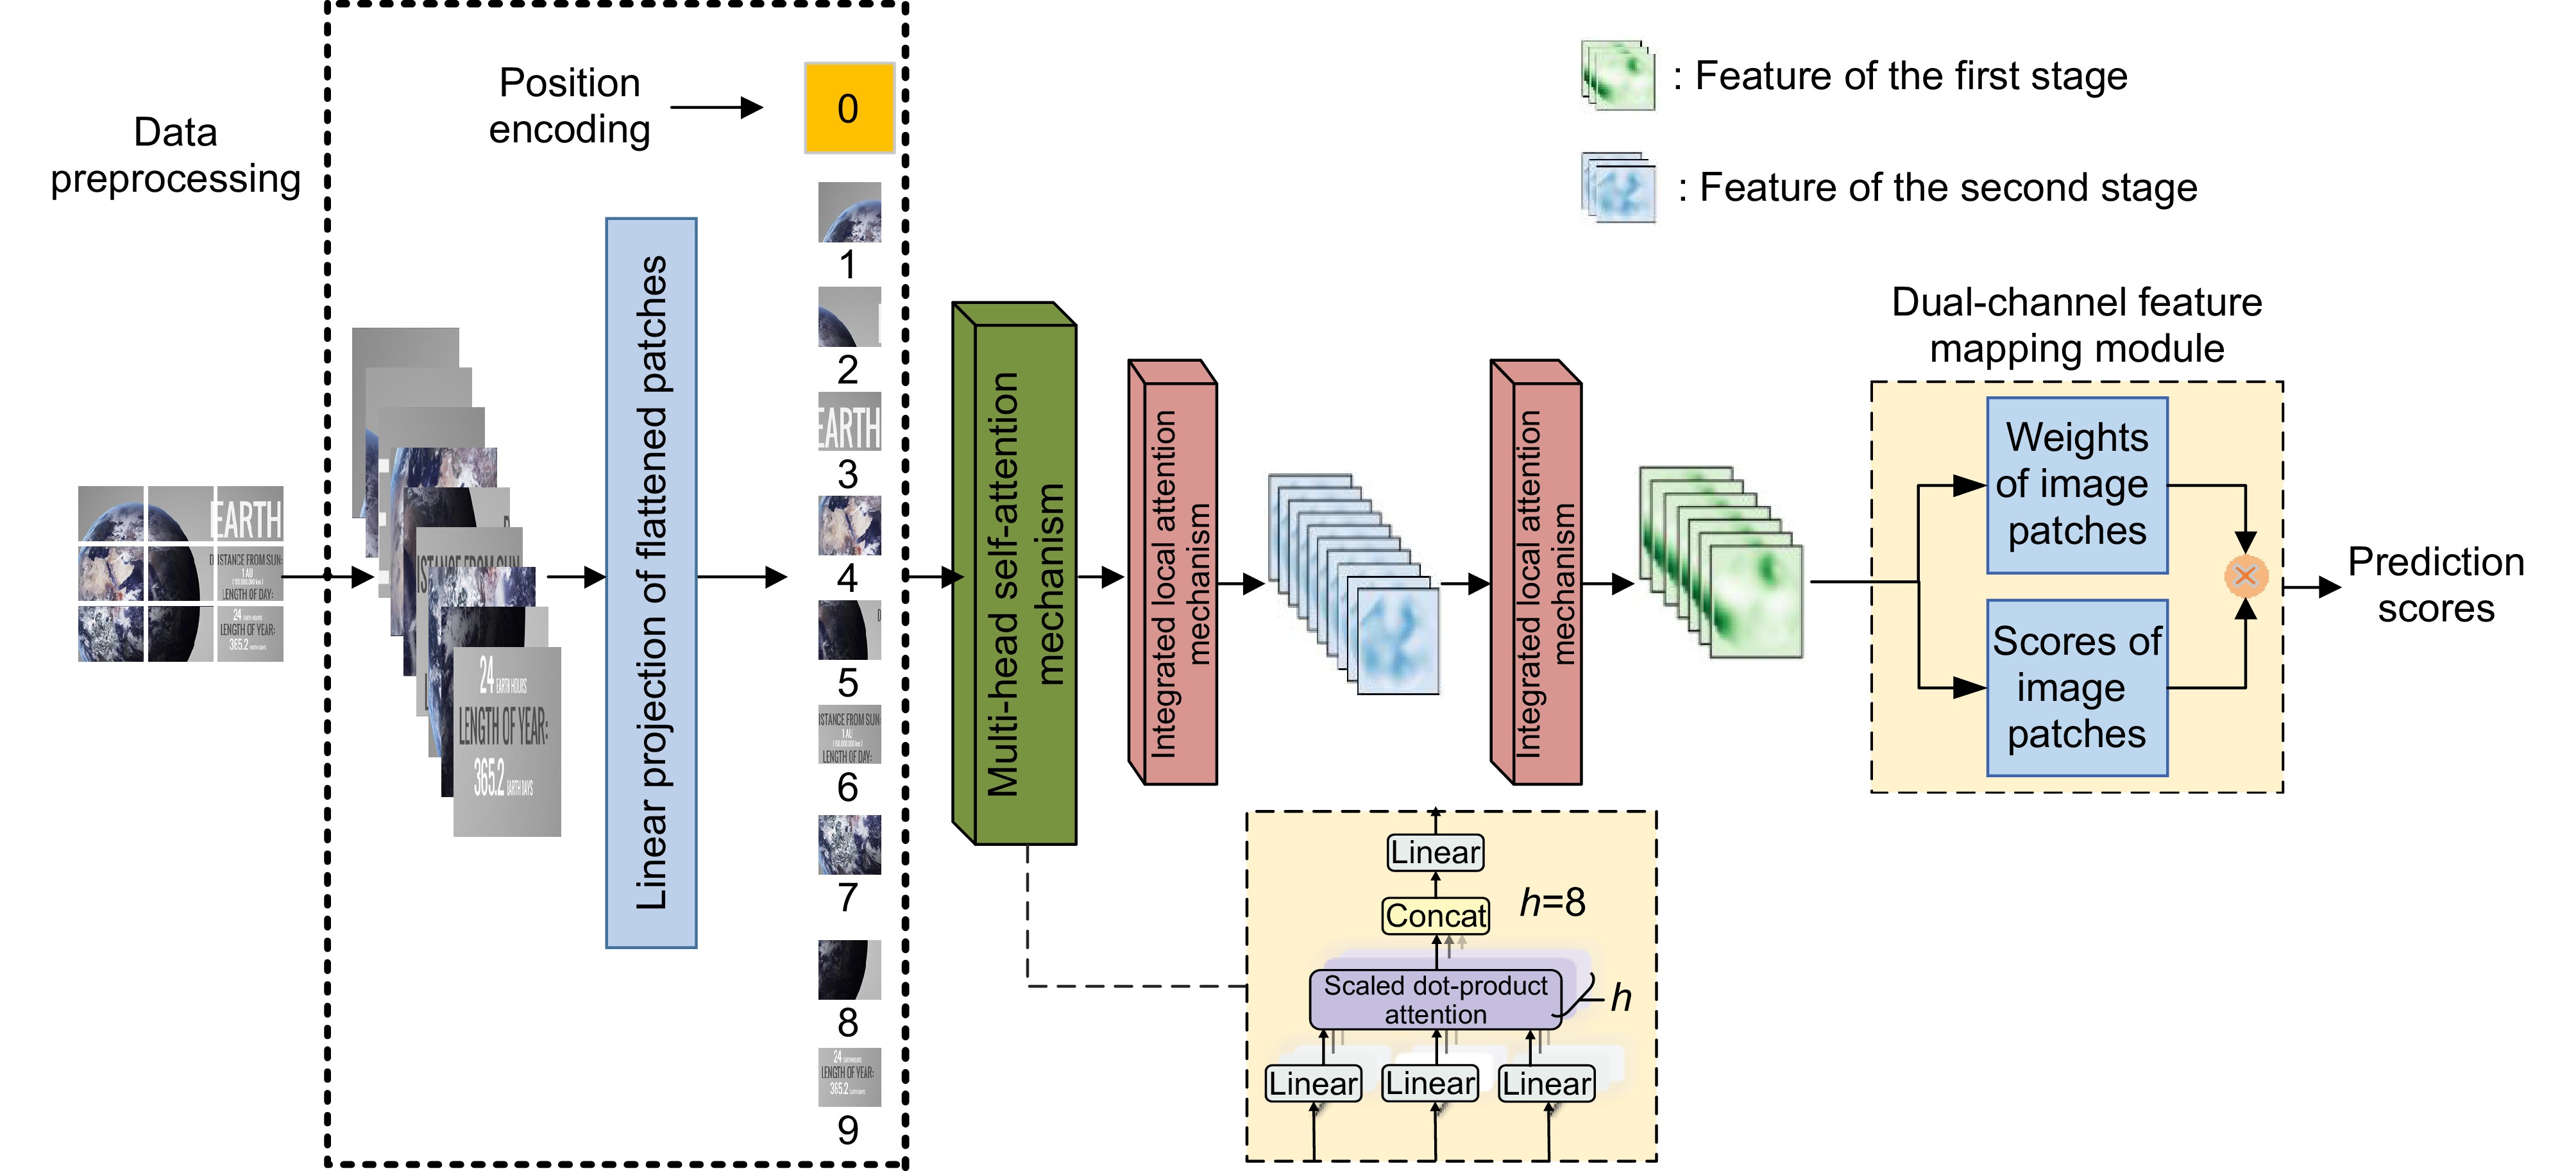
Overview: The previous screen content image quality assessment algorithms failed to fully consider the multi-level visual perception characteristics of the human eye. To address this limitation, we propose a multi-task attention mechanism-based no-reference quality assessment algorithm for screen content images (MTA-SCI), which better simulates human visual perception. The MTA-SCI combined the advantages of both global and local features of SCIs, enabling it to capture the overall structure while focusing on visually significant details. This approach significantly enhanced the SCI quality evaluation capability. Specifically, the MTA-SCI employed a self-attention mechanism to extract global features, improving the representation of overall information in SCIs. Subsequently, it utilized an integrated local attention mechanism to extract local features, allowing the algorithm to focus on more salient and attention-grabbing details in the images and suppressing channels containing background texture noise, reducing the impact of background texture noise on image quality assessment. The integrated local attention mechanism consists of the group-wise attention mechanism with spatial shifts and asymmetric convolutional channel attention mechanism. In the MTA-SCI algorithm, they perform different tasks, working together to improve the performance of screen content image quality assessment. Finally, a dual-channel feature mapping module is adopted to predict SCI quality scores. In the first channel, it predicted the quality score of image patches; in the second channel, it predicted the saliency weights of the image patches. The dual-channel feature mapping module effectively quantifies the importance of different image patches within the overall image, making the predictions more aligned with subjective human assessments. Experiments on the SCID dataset demonstrate that the proposed MTA-SCI achieves a Spearman’s rank-order correlation coefficient (SROCC) of 0.9563 and a Pearson linear correlation coefficient (PLCC) of 0.9575. On the SIQAD dataset, it achieves an SROCC of 0.9274 and a PLCC of 0.9171. Overall, the multi-task attention mechanism consists of three components: multi-head self-attention mechanism, group-wise attention mechanism with spatial shifts, and asymmetric convolutional channel attention mechanism. These three attention mechanisms perform different tasks in the proposed MTA-SCI algorithm, working together to improve the performance of screen content image quality assessment. By integrating self-attention for global feature extraction, integrated local attention for detail refinement, and a dual-channel feature mapping module for prediction, MTA-SCI effectively captures the complex perceptual characteristics of the human visual system. The high performance achieved on benchmark datasets validates its accuracy and reliability, making it a promising solution for future applications in screen content image quality.
-

-
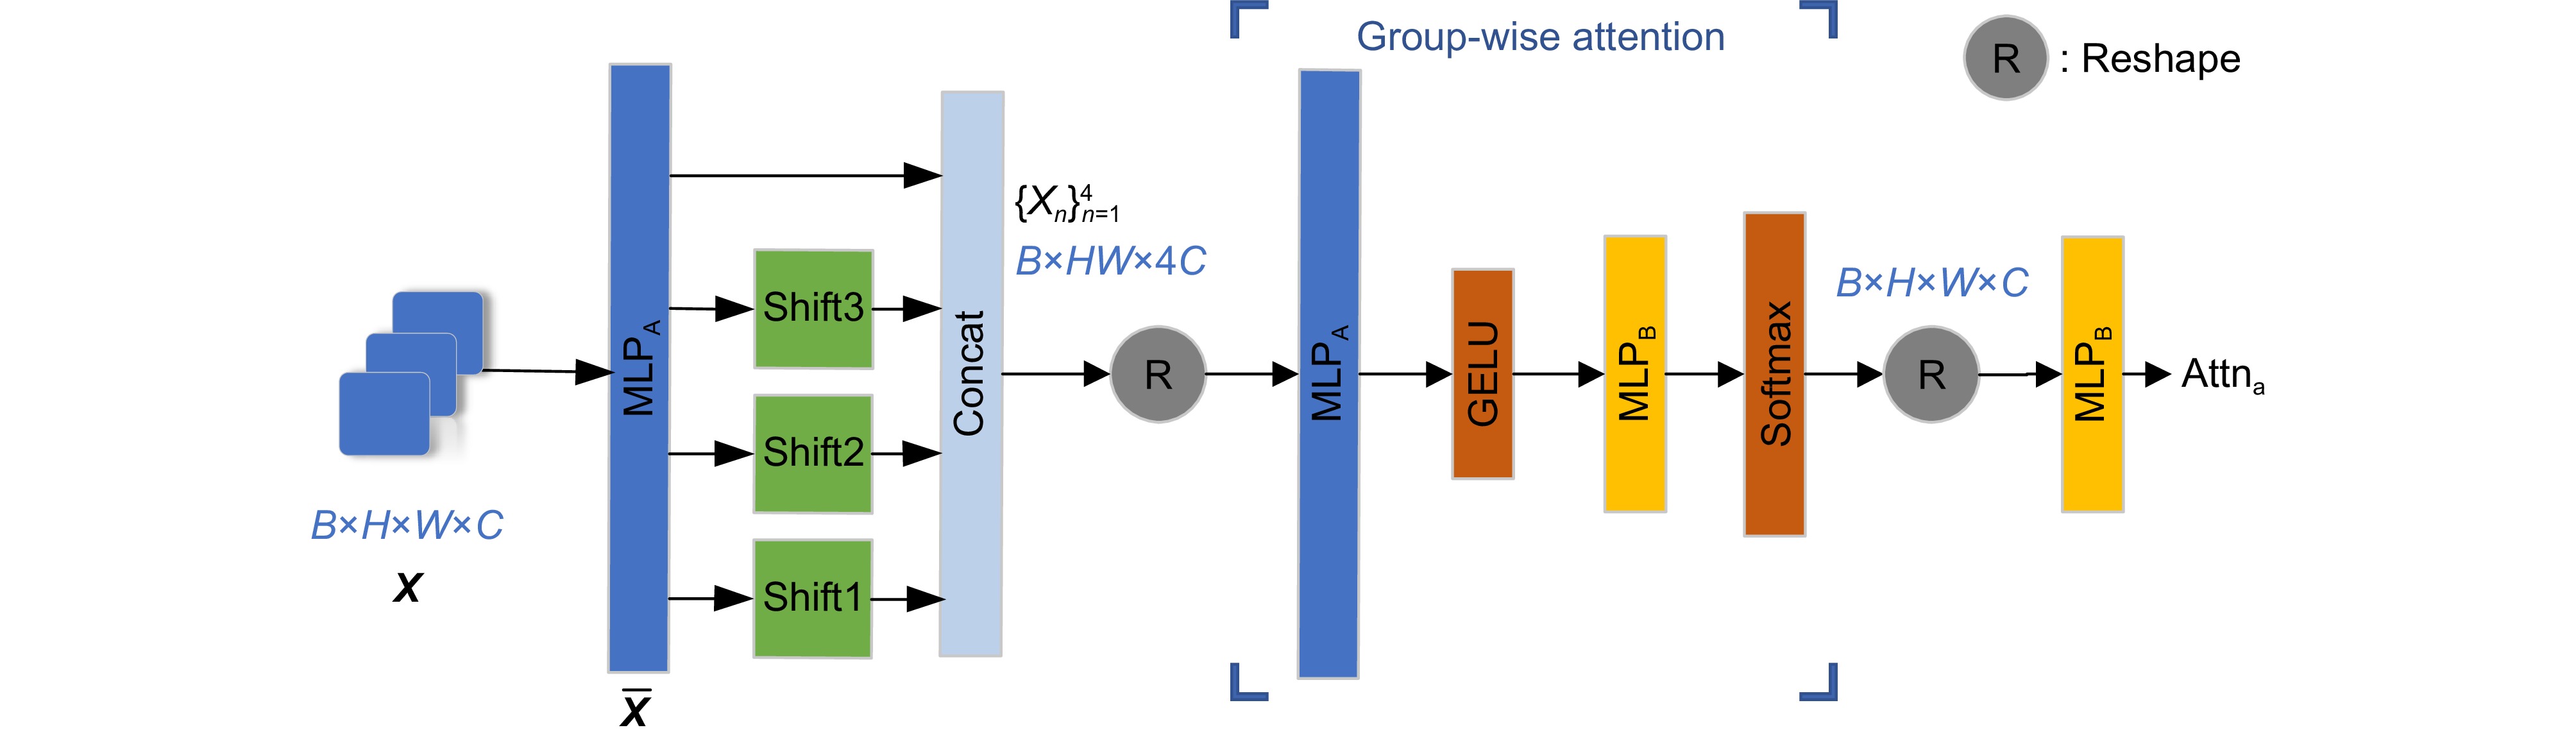
图 3 空间分组注意力机制的结构
Figure 3. Structure of group-wise attention mechanism with spatial shifts
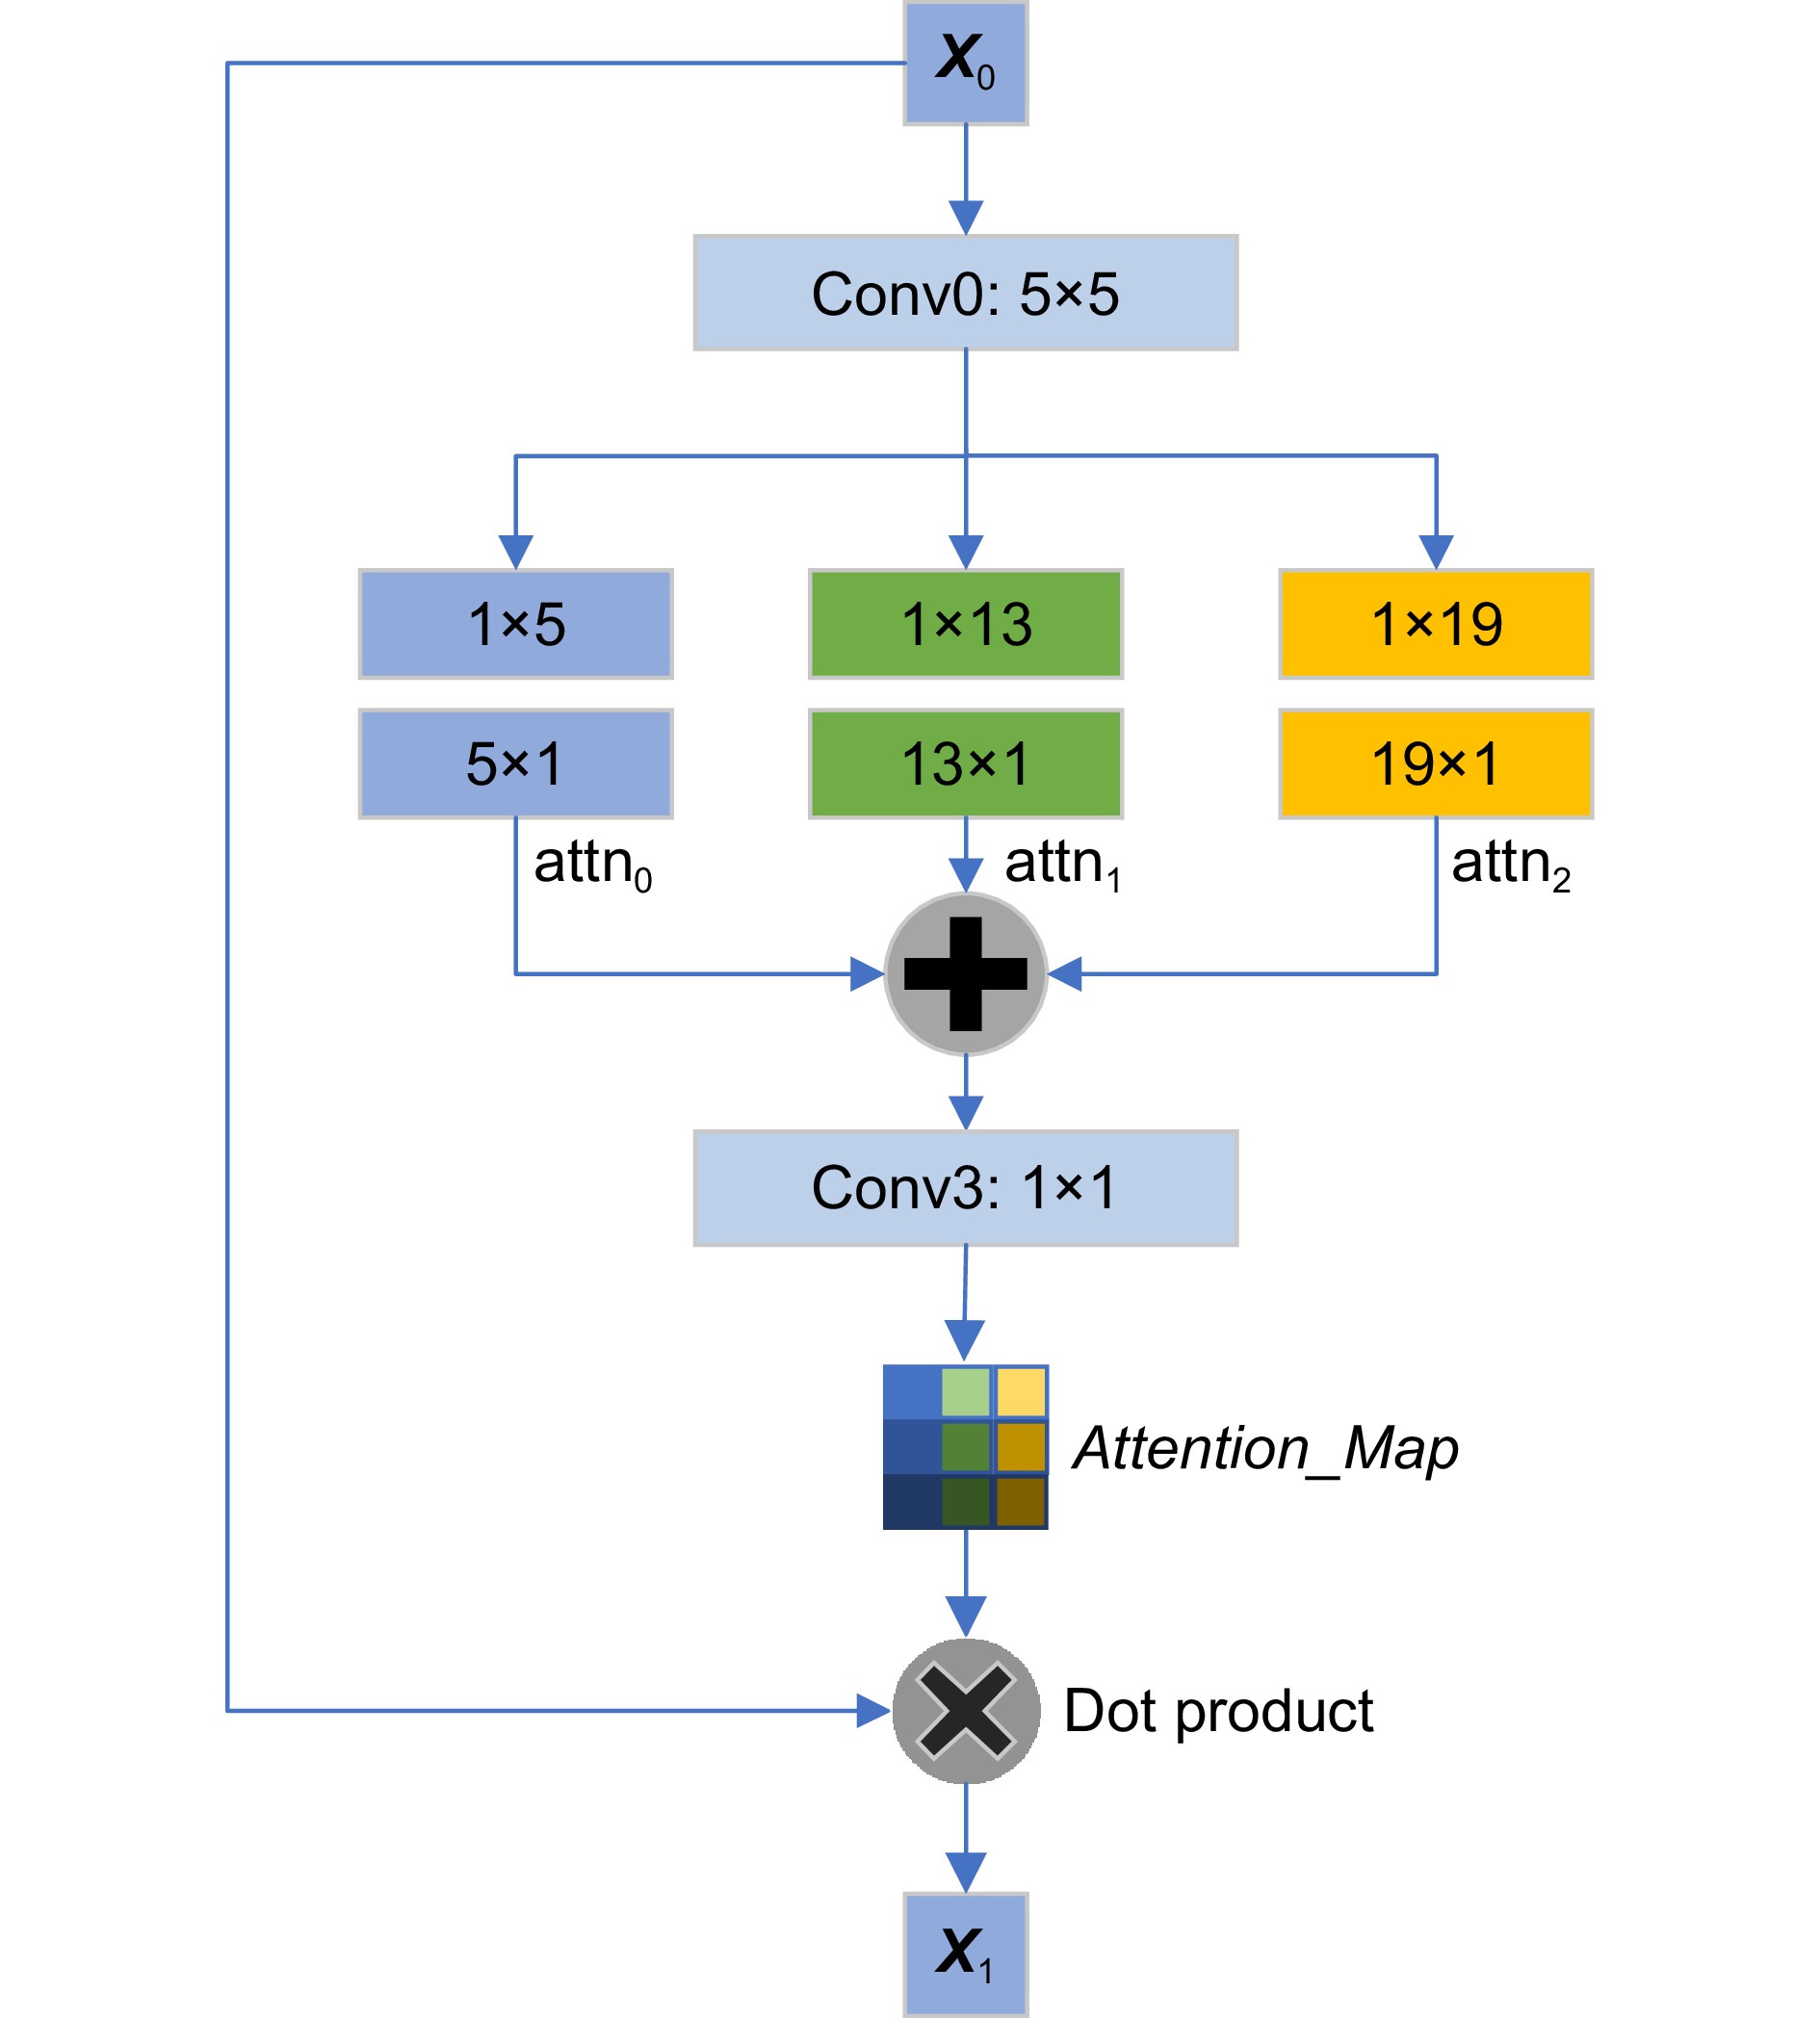
图 4 非对称卷积通道注意力机制的结构
Figure 4. Structure of asymmetric convolutional channel attention mechanism
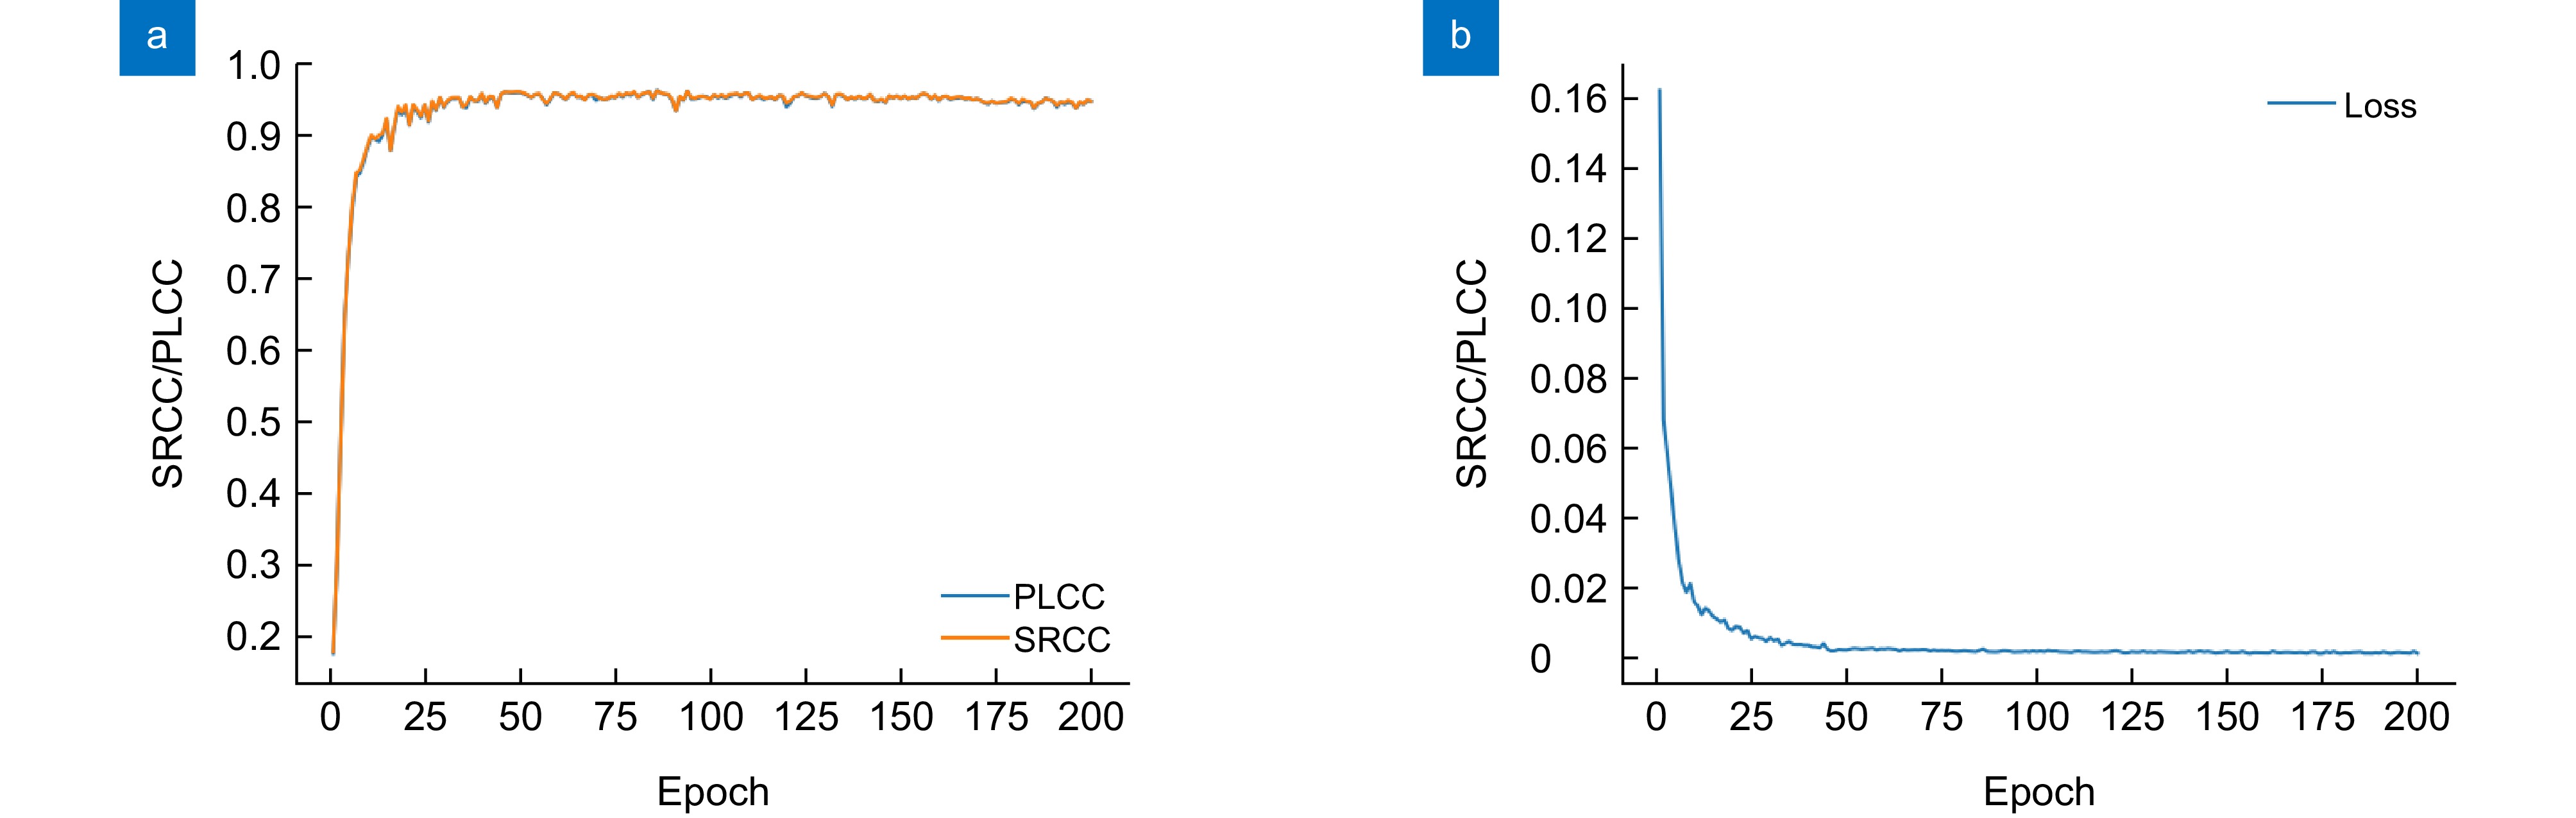
图 6 在SCID数据集上得到的PLCC、SRCC和损失值的变化曲线。(a) PLCC、SRCC的变化曲线;(b)损失值的变化曲线
Figure 6. Variation curves of PLCC, SRCC, and loss values obtained on the SCID dataset. (a) Variation curves of PLCC and SRCC; (b) Variation curve of the loss value
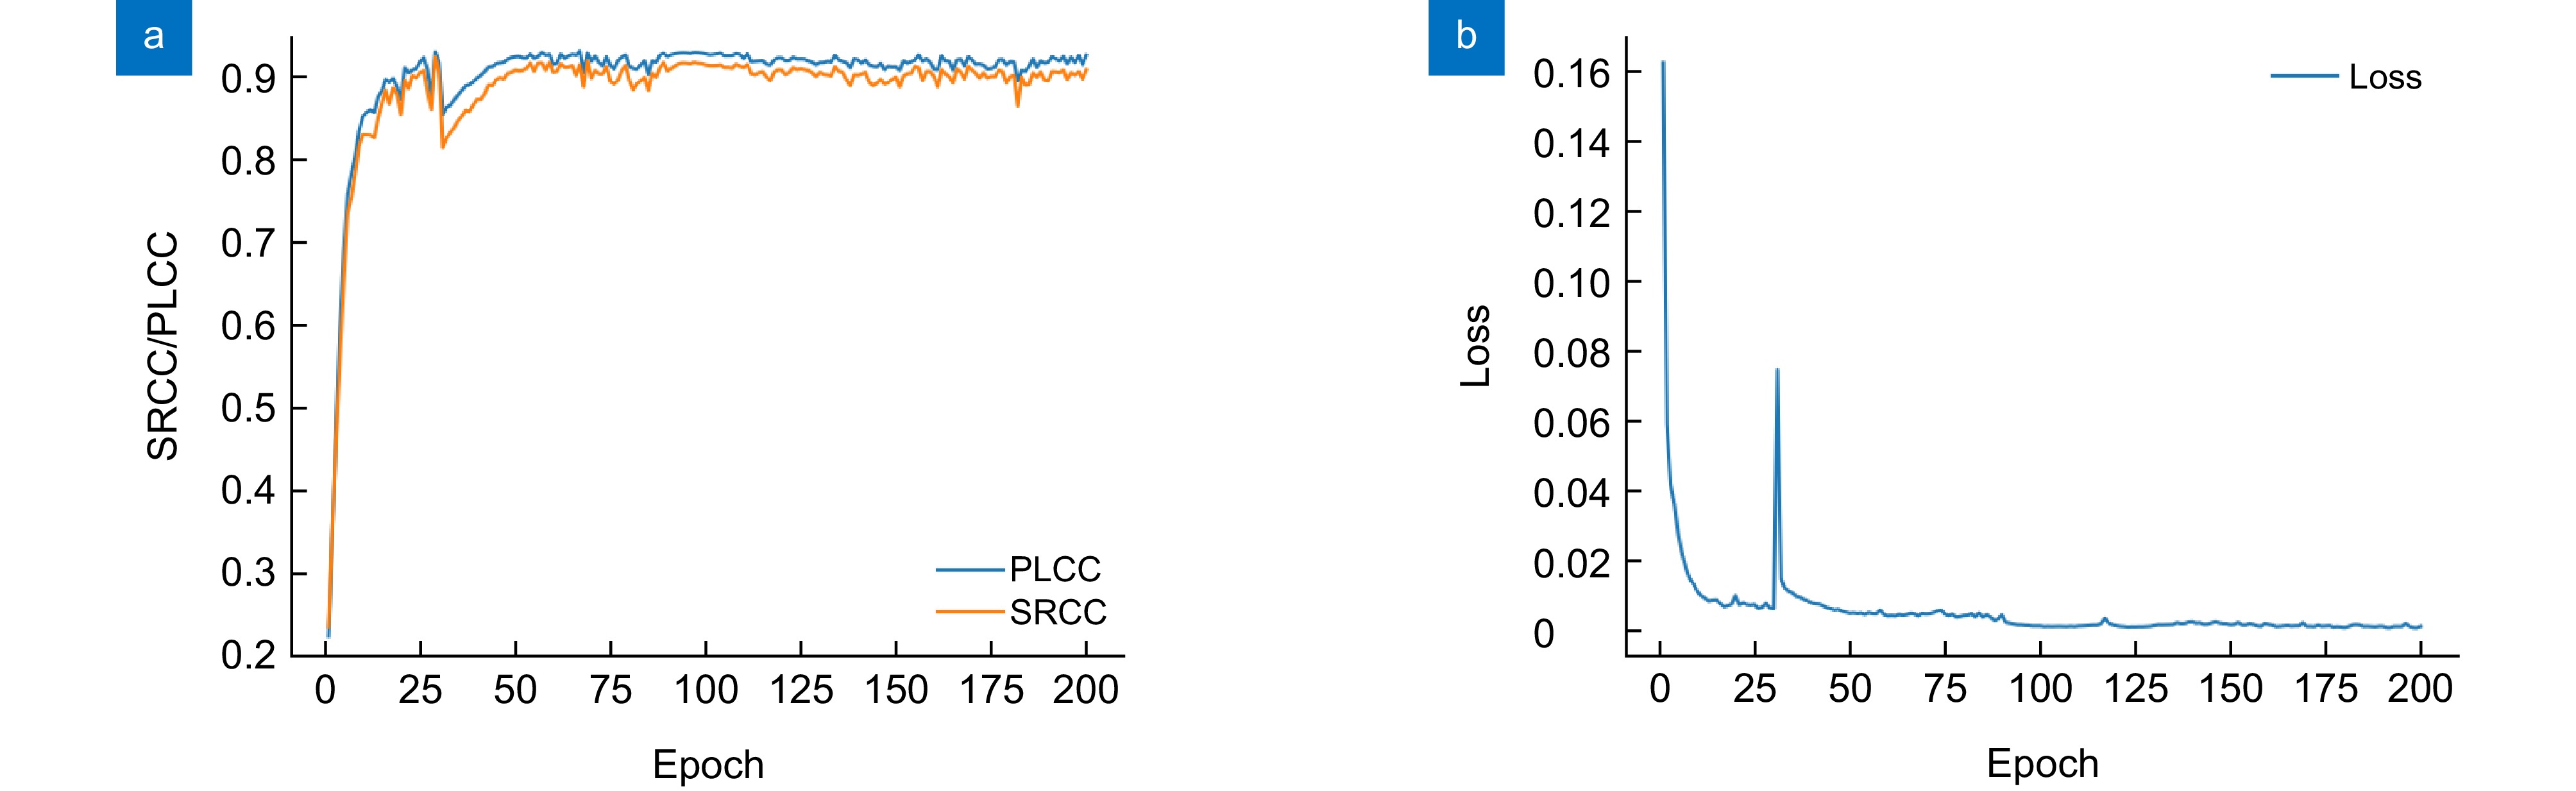
图 7 在SIQAD数据集上得到的PLCC、SRCC 和损失值的变化曲线。(a) PLCC、SRCC的变化曲线;(b)损失值的变化曲线
Figure 7. Variation curves of PLCC, SRCC, and loss values obtained on the SIQAD dataset. (a) Variation curves of PLCC and SRCC; (b) Variation curve of the loss value
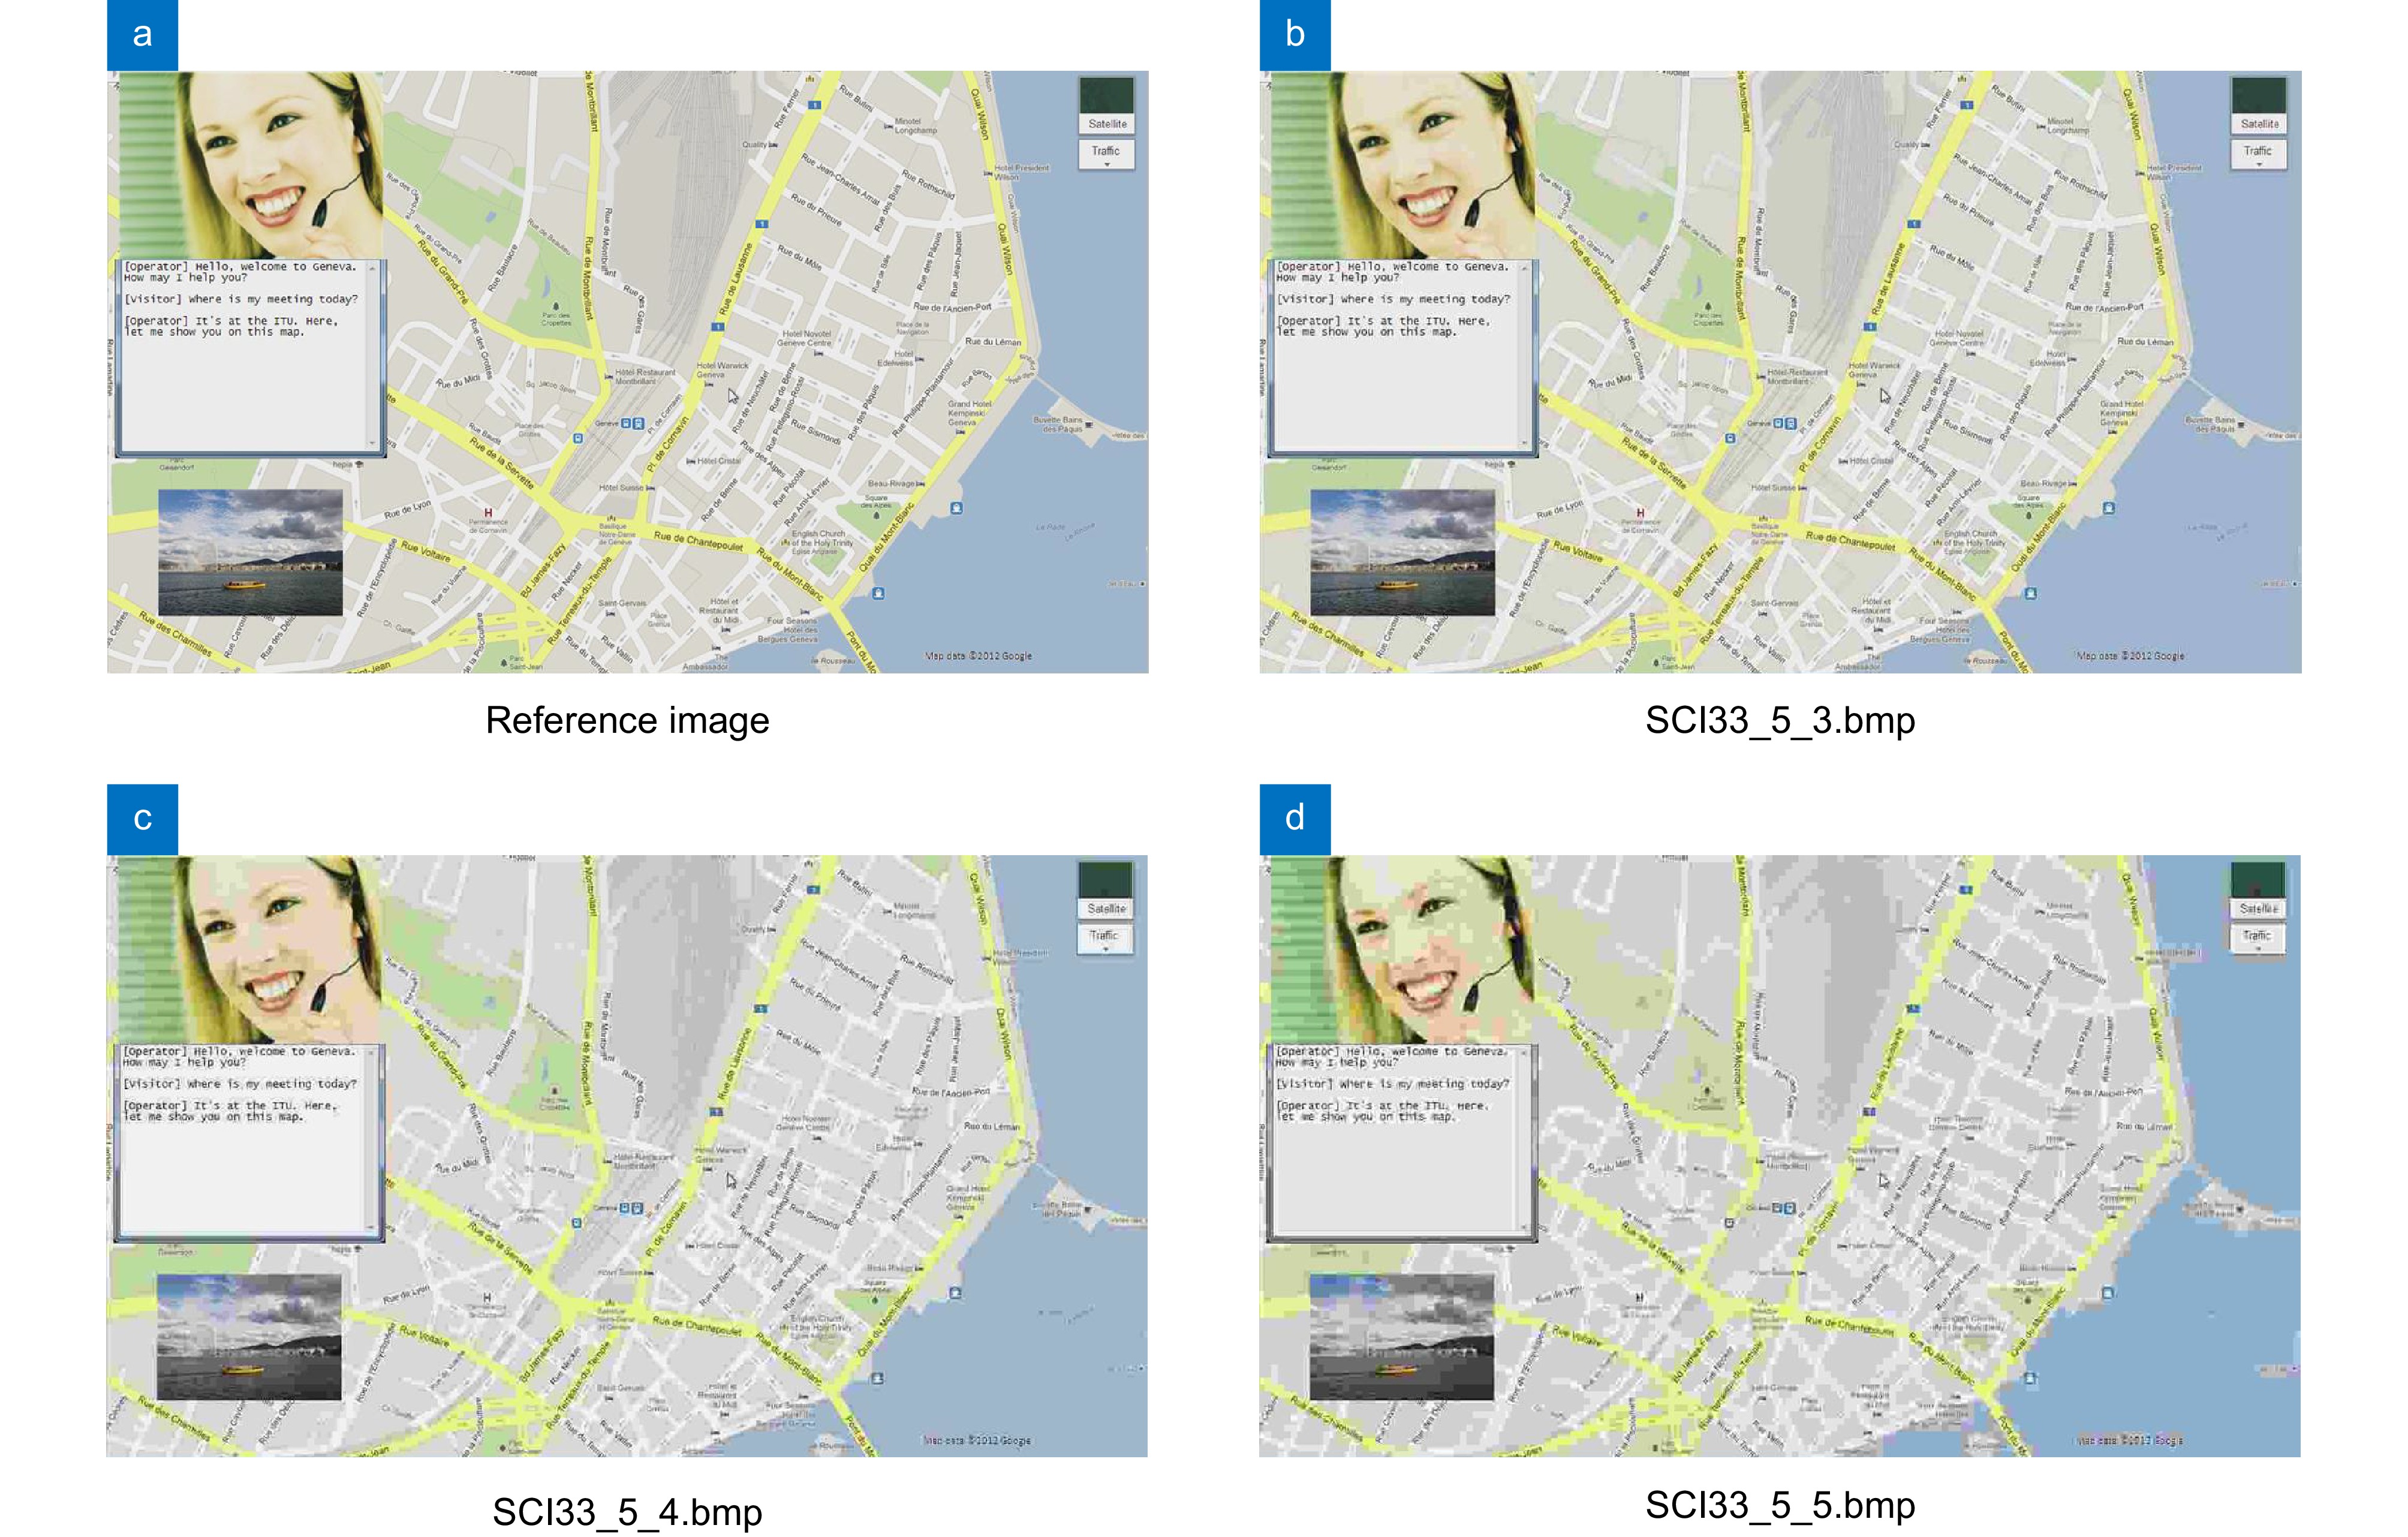
图 8 失真的屏幕内容图像实例。(a)参考图像;(b) SCI33_5_3.bmp;(c) SCI33_5_4.bmp;(d) SCI33_5_5.bmp
Figure 8. Distorted screen content image. (a) Reference image; (b) SCI33_5_3.bmp; (c) SCI33_5_4.bmp; (d) SCI33_5_5.bmp
表 1 典型的屏幕内容图像质量评价算法
Table 1. Typical methods of screen content image quality assessment
Category Method Type Feature The first category SPQA[6] FR Brightness and sharpness ESIM[9] FR Edge contrast MSDL[19] FR Feature extraction using log gabor filters BLIQUP-SCI[7] NR Natural scene statistics features and local texture Yang et al.[8] NR The amplitude, variance, entropy, and edge structure of wavelet coefficients Huang et al.[20] RR Oriented histogram, local discrete cosine transform coefficients, and gradient of
amplitude in color channelsThe second category SR-CNN[10] FR Multi-level CNN features QODCNN[12] FR/NR CNN features Gao et al.[15] NR CNN features Zhang et al.[16] NR CNN features MIC-CNN[13] NR CNN features SIQA-DF-II[11] NR CNN features RIQA[14] NR CNN features DAMC[21] FR CNN features MTDL[17] NR CNN features  下载: 导出CSV
表 2 基于分组的空间平移操作
Table 2. Group-based spatial shift operation
Xn Spatial shift n=1 Shift1:move tensor x1 down by one pixel vertically and right by one pixel horizontally n=2 Shift2:move tensor x2 down by two pixels vertically and right by two pixels horizontally n=3 Shift3:move tensor x3 right by one pixel horizontally and down by one pixel vertically n=4 Without any processing
下载: 导出CSV
表 3 卷积核的尺寸以及填充方式
Table 3. Convolutional kernel size and padding method
Convolution layer Kernel size Padding size Conv0 5×5 2×2 Conv0_1 1×5 0×2 Conv0_2 5×1 2×0 Conv1_1 1×13 0×6 Conv1_2 13×1 6×0 Conv2_1 1×19 9×0 Conv2_2 19×1 0×9 Conv3 1×1 1×1
下载: 导出CSV
表 4 常用的屏幕内容图像数据集
Table 4. Commonly used screen content image datasets
Dataset Number of reference Number of distortion Distortion types count Distortion levels count Subjective score type SCID 40 1800 9 5 MOS SIQAD 20 980 7 7 DMOS
下载: 导出CSV
表 5 实验的环境配置及其参数
Table 5. Environmental configuration and parameters of the experiment
Parameter Value Param count 307.94577 M Compilation Environment Python 3.7.0, Pytorch-GPU 1.13.1, and CUDA 11.3 CPU model Intel Core i7-13700 GPU model NVIDIA RTX 4090 Average time/epoch 90 s
下载: 导出CSV
表 6 各类屏幕图像质量评价算法的性能对比
Table 6. Performance comparison of various screen content image quality assessment algorithms
Type Method SCID SIQAD SRCC PLCC SRCC PLCC FR MIC-CNN[13] - - 0.9636 0.9669 ESIM[9] 0.8478 0.8630 0.8632 0.8788 DAMC[21] 0.9617 0.9617 0.9304 0.9373 SR-CNN[10] 0.9400 0.9390 0.8943 0.9042 NR Yang et al.[8] 0.7562 0.7867 0.8543 0.8738 QODCNN[12] 0.8760 0.8820 0.8890 0.9010 RIQA[14] - 0.9000 0.9110 Zhang et al.[16] 0.9050 0.9133 0.9242 0.9260 BLIQUP-SCI[7] - - 0.7990 0.7705 Yang et al.[8] 0.7562 0.7867 0.8543 0.8738 SIQA-DF-II[11] - - 0.8880 0.9000 Gao et al.[15] 0.8569 0.8613 0.8962 0.9000 MTDL[17] - - 0.9233 0.9248 DFSS-IQA[29] 0.8146 0.8138 0.8820 0.8818 Zhang[30] 0.9445 0.9433 0.8640 0.8889 MTA-SCI 0.9602 0.9609 0.9233 0.9294
下载: 导出CSV
表 7 失真图像的预测分数
Table 7. Predicted scores of the distorted screen content images
Image ID Prediction value MOS Normalized MOS SCI33_5_3.bmp 0.1067 36.7569 0.2711 SCI33_5_4.bmp 0.0653 25.4741 0.0619 SCI33_5_5.bmp 0.0658 25.6376 0.0650
下载: 导出CSV
表 8 不同的分组数量对MTA-SCI性能的影响
Table 8. Impact of different numbers of groups on the MTA-SCI performance
Group count PLCC SRCC k=2 0.9471 0.9520 k=3 0.9591 0.9587 k=4 0.9602 0.9609 k=5 0.9572 0.9487
下载: 导出CSV
表 9 不同非对称卷积核组合对MTA-SCI性能产生的影响
Table 9. Impact of different asymmetric convolution kernel combinations on the performance of the MTA-SCI
Kernel combination PLCC SRCC Kernal=3, 15, 19 0.9568 0.9585 Kernal=5, 7, 9 0.9569 0.9584 Kernal=5, 13, 19 0.9602 0.9609 Kernal=7, 11, 21 0.9575 0.9563 Kernal=9, 17, 25 0.9581 0.9589 Kernal=15, 23, 27 0.8967 0.9005
下载: 导出CSV
表 10 综合局部注意力机制、双通道特征映射模块和残差连接对模型性能的影响
Table 10. Impact of ILAM, DFM, and residual connection on the algorithm performance
No. ILAM DFM RC PLCC SRCC 1 × × × 0.8792 0.8651 2 × √ × 0.8832 0.8796 3 √ × × 0.9481 0.9508 4 √ √ × 0.9571 0.9592 5 √ √ √ 0.9602 0.9609
下载: 导出CSV
-
参考文献
[1] Nizami I F, Rehman M U, Majid M, et al. Natural scene statistics model independent no-reference image quality assessment using patch based discrete cosine transform[J]. Multimed Tools Appl, 2020, 79(35): 26285−26304. doi: 10.1007/s11042-020-09229-2
[2] Yang J C, Bian Z L, Zhao Y, et al. Full-reference quality assessment for screen content images based on the concept of global-guidance and local-adjustment[J]. IEEE Trans Broadcast, 2021, 67(3): 696−709. doi: 10.1109/TBC.2021.3064266
[3] 王斌, 白永强, 朱仲杰, 等. 联合空角信息的无参考光场图像质量评价[J]. 光电工程, 2024, 51(9): 69−81. doi: 10.12086/oee.2024.240139
Wang B, Bai Y Q, Zhu Z J, et al. No-reference light field image quality assessment based on joint spatial-angular information[J]. Opto-Electron Eng, 2024, 51(9): 69−81. doi: 10.12086/oee.2024.240139
[4] Bai Y Q, Zhu Z J, Zhu C H, et al. Blind image quality assessment of screen content images via fisher vector coding[J]. IEEE Access, 2022, 10: 13174−13181. doi: 10.1109/ACCESS.2022.3141914
[5] 鄢杰斌, 方玉明, 刘学林. 图像质量评价研究综述——从失真的角度[J]. 中国图像图形学报, 2022, 27(5): 1430−1466. doi: 10.11834/jig.210790
Yan J B, Fang Y M, Liu X L. The review of distortion-related image quality assessment[J]. J Image Graphics, 2022, 27(5): 1430−1466. doi: 10.11834/jig.210790
[6] Yang H, Fang Y M, Lin W S. Perceptual quality assessment of screen content images[J]. IEEE Trans Image Process, 2015, 24(11): 4408−4421. doi: 10.1109/TIP.2015.2465145
[7] Shao F, Gao Y, Li F C, et al. Toward a blind quality predictor for screen content images[J]. IEEE Trans Syst Man Cybern Syst, 2018, 48(9): 1521−1530. doi: 10.1109/TSMC.2017.2676180
[8] Yang J C, Zhao Y, Liu J C, et al. No reference quality assessment for screen content images using stacked autoencoders in pictorial and textual regions[J]. IEEE Trans Cybern, 2022, 52(5): 2798−2810. doi: 10.1109/TCYB.2020.3024627
[9] Ni Z K, Ma L, Zeng H Q, et al. ESIM: edge similarity for screen content image quality assessment[J]. IEEE Trans Image Process, 2017, 26(10): 4818−4831. doi: 10.1109/TIP.2017.2718185
[10] Chen C L Z, Zhao H M, Yang H, et al. Full-reference screen content image quality assessment by fusing multilevel structure similarity[J]. ACM Trans Multimedia Comput Commun Appl, 2021, 17(3): 1−21. doi: 10.1145/3447393
[11] Jiang X H, Shen L Q, Ding Q, et al. Screen content image quality assessment based on convolutional neural networks[J]. J Vis Commun Image Represent, 2020, 67: 102745. doi: 10.1016/j.jvcir.2019.102745
[12] Jiang X H, Shen L Q, Feng G R, et al. An optimized CNN-based quality assessment model for screen content image[J]. Signal Process Image Commun, 2021, 94: 116181. doi: 10.1016/j.image.2021.116181
[13] Zuo L X, Wang H L, Fu J. Screen content image quality assessment via convolutional neural network[C]//23rd IEEE International Conference on Image Processing, 2016: 2082–2086. https://doi.org/10.1109/ICIP.2016.7532725.
[14] Jiang X H, Shen L Q, Yu L W, et al. No-reference screen content image quality assessment based on multi-region features[J]. Neurocomputing, 2020, 386: 30−41. doi: 10.1016/j.neucom.2019.12.027
[15] Gao R, Huang Z Q, Liu S G. Multi-task deep learning for no-reference screen content image quality assessment[C]//27th International Conference on MultiMedia Modeling, 2021: 213–226. https://doi.org/10.1007/978-3-030-67832-6_18.
[16] Zhang C F, Huang Z Q, Liu S G, et al. Dual-channel multi-task CNN for no-reference screen content image quality assessment[J]. IEEE Trans Circuits Syst Video Technol, 2022, 32(8): 5011−5025. doi: 10.1109/TCSVT.2022.3143321
[17] Yang J C, Bian Z L, Zhao Y, et al. Staged-learning: assessing the quality of screen content images from distortion information[J]. IEEE Signal Process Lett, 2021, 28: 1480−1484. doi: 10.1109/LSP.2021.3091928
[18] 潘李琳, 邵剑飞. 融合图注意力的多分辨率点云补全[J]. 激光技术, 2023, 47(5): 700−707. doi: 10.7510/jgjs.issn.1001-3806.2023.05.019
Pan L L, Shao J F. Multi-resolution point cloud completion fusing graph attention[J]. Laser Technol, 2023, 47(5): 700−707. doi: 10.7510/jgjs.issn.1001-3806.2023.05.019
[19] Chang Y L, Li S M, Liu A Q, et al. Quality assessment of screen content images based on multi-stage dictionary learning[J]. J Vis Commun Image Represent, 2021, 79: 103248. doi: 10.1016/j.jvcir.2021.103248
[20] Huang Z Q, Liu S G. Perceptual hashing with visual content understanding for reduced-reference screen content image quality assessment[J]. IEEE Trans Circuits Syst Video Technol, 2021, 31(7): 2808−2823. doi: 10.1109/TCSVT.2020.3027001
[21] Yao Y, Hu J T, Yang W M, et al. Distortion-aware mutual constraint for screen content image quality assessment[C]//12th International Conference on Image and Graphics, 2023: 403–414. https://doi.org/10.1007/978-3-031-46305-1_33.
[22] Rehman M U, Nizami I F, Majid M. DeepRPN-BIQA: deep architectures with region proposal network for natural-scene and screen-content blind image quality assessment[J]. Displays, 2022, 71: 102101. doi: 10.1016/J.DISPLA.2021.102101
[23] Min X K, Gu K, Zhai G T, et al. Screen content quality assessment: overview, benchmark, and beyond[J]. ACM Comput Surv, 2022, 54(9): 187. doi: 10.1145/3470970
[24] Dosovitskiy A, Beyer L, Kolesnikov A, et al. An image is worth 16×16 words: transformers for image recognition at scale[C]//9th International Conference on Learning Representations, 2021.
[25] 任烈弘, 黄铝文, 田旭, 等. 基于DFT的频率敏感双分支Transformer多变量长时间序列预测方法[J]. 计算机应用, 2024, 44(9): 2739−2746. doi: 10.11772/j.issn.1001-9081.2023091320
Ren L H, Huang L W, Tian X, et al. Multivariate long-term series forecasting method with DFT-based frequency-sensitive dual-branch transformer[J]. J Comput Appl, 2024, 44(9): 2739−2746. doi: 10.11772/j.issn.1001-9081.2023091320
[26] Chen L, Zhang H W, Xiao J, et al. SCA-CNN: spatial and channel-wise attention in convolutional networks for image captioning[C]//2017 IEEE Conference on Computer Vision and Pattern Recognition, 2017: 6298–6306. https://doi.org/10.1109/CVPR.2017.667.
[27] Yu L L, Zhang X B, Wang K. CMAAC: combining multiattention and asymmetric convolution global learning framework for hyperspectral image classification[J]. IEEE Trans Geosci Remote Sens, 2024, 62: 5508518. doi: 10.1109/TGRS.2024.3361555
[28] Ding X H, Guo Y C, Ding G G, et al. ACNet: strengthening the kernel skeletons for powerful CNN via asymmetric convolution blocks[C]//17th IEEE/CVF International Conference on Computer Vision, 2019: 1911–1920. https://doi.org/10.1109/ICCV.2019.00200.
[29] Chen B L, Zhu H W, Zhu L Y, et al. Deep feature statistics mapping for generalized screen content image quality assessment[J]. IEEE Trans Image Process, 2024, 33: 3227−3241. doi: 10.1109/TIP.2024.3393754
[30] 张巍. 基于多尺度卷积神经网络屏幕内容图像无参考质量评价方法[J]. 辽宁工业大学学报(自然科学版), 2024, 44(5): 286−291. doi: 10.15916/j.issn1674-3261.2024.05.002
Zhang W. No-reference quality assessment method for screen content image based on multi-scale convolutional neural network[J]. J Liaoning Univ Technol Nat Sci Ed, 2024, 44(5): 286−291. doi: 10.15916/j.issn1674-3261.2024.05.002
[31] 郭佳霖, 智敏, 殷雁君, 等. 图像处理中CNN与视觉Transformer混合模型研究综述[J]. 计算机科学与探索, 2025, 19(1): 30−44. doi: 10.3778/j.issn.1673-9418.2403009
Guo J L, Zhi M, Yin Y J, et al. Review of research on CNN and visual Transformer hybrid models in image processing[J]. J Front Comput Sci Technol, 2025, 19(1): 30−44. doi: 10.3778/j.issn.1673-9418.2403009
-
访问统计


 点击扫一扫
点击扫一扫
图(9)
表(10)
计量
- 文章访问数:
- PDF下载数:
- 施引文献: 0


