Optimization of sparse subaperture array model for stitching detection of plane wavefront
-
摘要
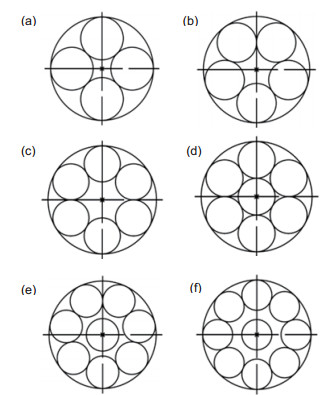
稀疏子孔径拼接检测是大口径、超大口径光学系统像质检测的主要方法之一,其拼接检测的精度与子孔径排列方式、数目以及大小密切相关。本文通过建立数学模型,推导出子孔径个数k在1到无穷区间取值,子孔径个数k与填充因子M的关系曲线,从而得出在1.5 m以下系统检测的最优的七个稀疏子孔径排列布局图,并通过Φ200 mm自准干涉检验,验证了这种排列布局的合理性。

Abstract
The sparse subaperture stitching, the accuracy of which is closely related to the arrangement, number and size of subapertures, is one of the main methods of quality testing for large aperture optical systems. A mathematical model was established to deduce the relation curve between the subaperture number k and fill factor M when the value of k ranges from one to infinity. As a result, the optimal arrangement layout, consisting of seven sparse subapertures, was obtained for the detection systems below 1.5 m. Autocollimation interference detection of Φ200 mm validated the rationality of the arrangement.
-
Overview

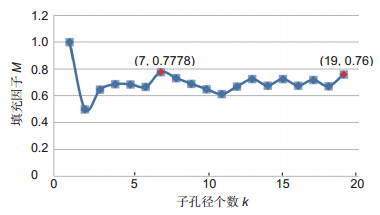
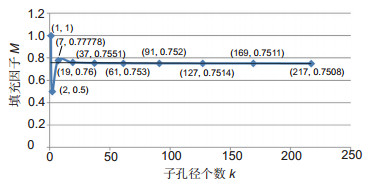
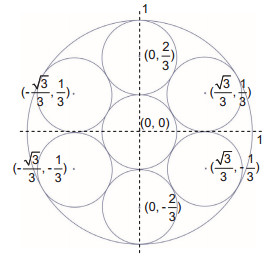
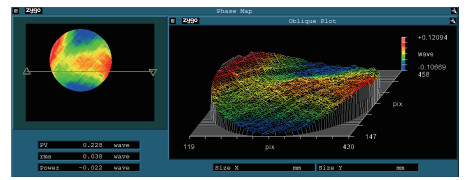
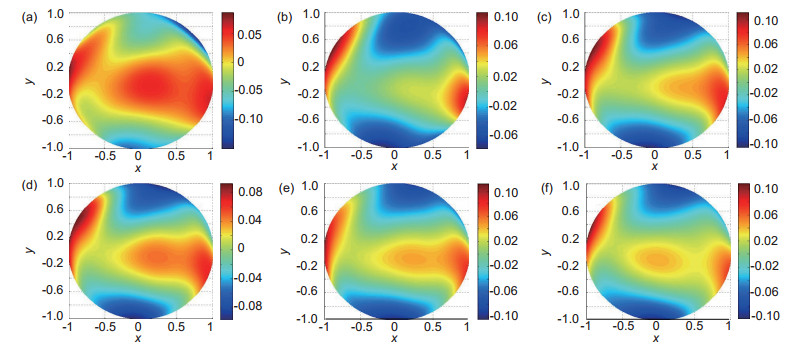
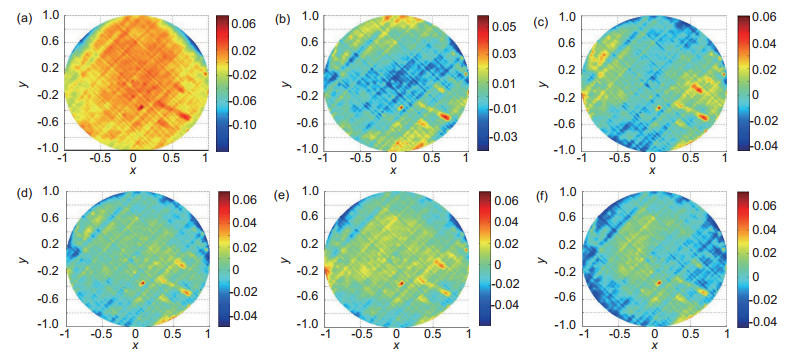
Overview: The sparse subaperture stitching is one of the main methods of quality detection for large and oversized aperture optical systems. Tradition methods using parallel light pipe and plane mirror autocollimation have some limitations, and they are difficult to realize full-caliber high-precision wavefront aberration detection. The sparse subaperture stitching is based on the principle of interference autocollimation, and the system contains three parts, including interferometer, optical system to be measured and a plane mirror. Unlike overlapping subaperture stitching, a plurality of small aperture plane mirror structure according to the arrangement of a certain composition sparse aperture can replace a large flat mirror. Each subaperture wavefront information was used to reconstruct the full aperture wavefront by stitching algorithm to achieve the required accuracy. The precision of stitching algorithm is closely related to the arrangement, number and size of subaperture, and the coverage ratio of the subapertures in the whole region is represented by the filling factor M. Therefore the better M, the better the precision of stitching algorithm. In this paper, a mathematical model was established to deduce the relation curve between the subaperture number k and fill factor M when the value of k ranges from one to infinite. Though the relation curve between the subaperture number k and fill factor M, the maximum value of fill factor M=0.77778 was obtained when k equals to 7. As a result, the coverage ratio of the subapertures in the whole region is the largest, which collects most of the information. Seven sparse subapertures, which is the optimal layout diagram for the detection systems below 1.5 m was selected. Multiple subapertures ranging from 4 to 9 were stitching and detected, respectively. After stitching, the data were processed by removing tilt The data of the stitching wavefront and the full aperture test data were subtracted, and the residual error was compared. The obtained RMS is 0.0391λ and the direct detection RMS is 0.038λ when sampling the wavefront data with seven subapertures. The relative error is 2%. The residual wavefront RMS between stitching and direct detection is 0.0092λ. Compared with other subaperture, the reconstructed full-aperture wavefront is the most consistent with directly detected full-aperture wavefront, which verifies the rationality of the mathematical model. That is to say, self-collimation interference detection of Φ200 mm demonstrates the rationality of the arrangement.
-

-
图 9 四到九个子孔径拼接检测的全孔径波前图。(a)四个子孔径;(b)五个子孔径;(c)六个子孔径;(d)七个子孔径;(e)八个子孔径;(f)九个子孔径
Figure 9. Full aperture wavefront mapping for multiple subaperture stitching detection. (a) Four subapertures; (b) Five subapertures; (c) Six subapertures; (d) Seven subapertures; (e) Eight subapertures; (f) Nine subapertures
图 10 四到九个子孔径拼接检测与直接检测波前的残差图。(a)四个子孔径;(b)五个子孔径;(c)六个子孔径;(d)七个子孔径;(e)八个子孔径;(f)九个子孔径
Figure 10. Wavefront residuals between stitching and direct detection with multiple subapertures. (a) Four subapertures; (b) Five subapertures; (c) Six subapertures; (d) Seven subapertures; (e) Eight subapertures; (f) Nine subapertures
表 1 子孔径个数k与对应的填充因子M (k取2~7)
Table 1. Subaperture number k and fill factor M (k= 2~7)
k 2 3 4 5 6 7 M 0.5 0.64617 0.68629 0.68521 0.66667 0.77778 表 2 子孔径个数k与对应的填充因子M (k取8~19)
Table 2. Subaperture number k and fill factor M (k= 8~19)
k 8 9 10 11 12 13 14 15 16 17 18 19 M 0.732 0.689 0.649 0.613 0.668 0.724 0.676 0.724 0.676 0.718 0.671 0.76 表 3 拼接与直接测得的全口径波前各项参数对比
Table 3. Comparison of parameters of stitching and direct detection
No. Wavefront PV/λ Wavefront RMS/λ Wavefront residuals PV/λ Wavefront residuals RMS/λ 4 0.2369 0.0377 0.2150 0.0169 5 0.1781 0.0337 0.0987 0.0107 6 0.2136 0.0433 0.1039 0.0103 7 0.1901 0.0391 0.1160 0.0092 8 0.2147 0.0399 0.1288 0.0109 9 0.2069 0.0363 0.1186 0.0110 -
参考文献
[1] 侯溪, 伍凡, 杨力, 等.子孔径拼接干涉测试技术现状及发展趋势[J].光学与光电技术, 2005, 3(3): 50–53. https://www.wenkuxiazai.com/doc/2697afd126fff705cc170ab0-2.html
Hou X, Wu F, Yang L, et al. Status and development trend of sub-aperture stitching interferometric testing technique[J]. Optics & Optoelectronic Technology, 2005, 3(3): 50–53. https://www.wenkuxiazai.com/doc/2697afd126fff705cc170ab0-2.html
[2] Sj dahl M, Oreb B F. Stitching interferometric measurement data for inspection of large optical components[J]. Optical Engineering, 2002, 41(2): 403–408. doi: 10.1117/1.1430727
[3] Kim C J. Polynomial fit of interferograms[J]. Applied Optics, 1982, 21(24): 4521–4525. doi: 10.1364/AO.21.004521
[4] He Y, Wang Z X, Wang Q, et al. Testing the large aperture optical components by the sub-aperture stitching interferometer [J]. Proceedings of SPIE, 2007, 6624: 66240D. https://www.spiedigitallibrary.org/conference-proceedings-of-spie/6624/1/Testing-the-large-aperture-optical-components-by-the-sub-aperture/10.1117/12.791064.full
[5] Xu X D, Shen Z X, Tong G D, et al. Sparse subaperture stitching method for measuring large aperture planar optics[J]. Optical Engineering, 2016, 55(2): 024103. doi: 10.1117/1.OE.55.2.024103
[6] 闫锋涛, 范斌, 侯溪, 等.稀疏子孔径采样检测大口径光学器件[J].强激光与粒子束, 2011, 23(12): 3193–3196. http://www.opticsjournal.net/abstract.htm?id=OJ120104000308OlRoUq
Yan F T, Fan B, Hou X, et al. Large-aperture mirror test using sparse sub-aperture sampling[J]. High Power Laser and Particle Beams, 2011, 23(12): 3193–3196. http://www.opticsjournal.net/abstract.htm?id=OJ120104000308OlRoUq
[7] Chow W W, Lawrence G N. Method for subaperture testing interferogram reduction[J]. Optics Letters, 1983, 8(9): 468–470. doi: 10.1364/OL.8.000468
[8] 王琰, 伏瑞敏, 廖志波.基于稀疏孔径的波前重构算法[J].航天返回与遥感, 2015, 36(5): 51–59. http://www.cqvip.com/QK/91734A/201505/666551202.html
Wang Y, Fu R M, Liao Z B. Wavefront reconstruction algorithm based on sparse aperture[J]. Spacecraft Recovery & Remote Sensing, 2015, 36(5): 51–59. http://www.cqvip.com/QK/91734A/201505/666551202.html
[9] Chen S Y, Dai Y F, Li S Y, et al. Error reductions for stitching test of large optical flats[J]. Optics & Laser Technology, 2012, 44(5): 1543–1550. https://www.sciencedirect.com/science/article/pii/S0030399211003902
[10] Smith G A, Burge J H. Subaperture stitching surface errors due to noise[J]. Proceedings of SPIE, 2015, 9575: 95750W. doi: 10.1117/12.2188085
[11] Hill J M, Salinari P. The large binocular telescope project[J]. Proceedings of SPIE, 2000, 5489: 603–614. https://www.spiedigitallibrary.org/conference-proceedings-of-spie/5489/1/The-Large-Binocular-Telescope-project/10.1117/12.550556.full
[12] Chung S J, Miller D W, De Weck O L. Design and implementation of sparse aperture imaging systems[J]. Proceeding of SPIE, 2002, 4849: 181–192. doi: 10.1117/12.460077
-
访问统计


 E-mail Alert
 RSS
RSS
 下载:
下载:

