
 E-mail Alert
 RSS
RSS
Spectral reduction algorithm for echelle grating spectrometer based on least-squares image coordinate correction
-
摘要
中阶梯光谱仪具有交叉色散特征,二维谱图还原是决定其波长测量准确性的关键环节,但是环境变化、加工装调等引起的光斑坐标变化对谱图还原精度造成严重影响。本文提出了一种基于最小二乘图像坐标修正的中阶梯光谱仪谱图还原算法,首先提取校准汞灯光源多波长光斑质心坐标,利用理论像点和实际像点坐标构建系数矩阵,通过最小二乘法估计获得二维像面的平移、缩放、旋转系数,再采用多项式拟合减小残差影响,实现不同波长光斑的图像坐标修正,进而实现波长精确解算。实验结果显示,该算法能有效提高中阶梯光谱仪的谱图还原精度,在模拟较大装调误差条件下,修正后坐标与理想坐标偏差小于0.6个像元,证明了该算法具有较高的精度。
Abstract
The echelle grating spectrometer has cross-dispersion characteristics, and two-dimensional spectral map reduction is the key link to determine its wavelength measurement accuracy, but the changes of spot coordinates caused by environmental changes, processing and mounting have a serious impact on the accuracy of spectral map reduction. In this paper, a spectrum reduction algorithm based on least-squares image coordinate correction is proposed for the middle-step spectrometer. Firstly, the center-of-mass coordinates of the multi-wavelength spot of the calibrated mercury lamp light source are extracted, and the coefficient matrix is constructed by using the theoretical and actual image point coordinates. The translation, scaling, and rotating coefficients of the two-dimensional image plane are obtained by the least-squares estimation method, and then a polynomial fitting is adopted to reduce the influence of residuals, to achieve the correction of the image coordinates of the spot at different wavelengths, and then achieve the accurate resolution of wavelength, and realize the wavelength accurate solving. The experimental results show that the algorithm can effectively improve the spectral image reduction accuracy of the middle-step spectrometer, and the deviation of the corrected coordinates from the ideal coordinates is less than 0.6 image element under the condition of simulating larger mounting errors, which proves that the algorithm has high accuracy.
-
Key words:
- spectroscopy /
- spectrometer /
- two-dimensional spectrogram /
- centroid extraction /
- spectrogram reduction
-
Overview
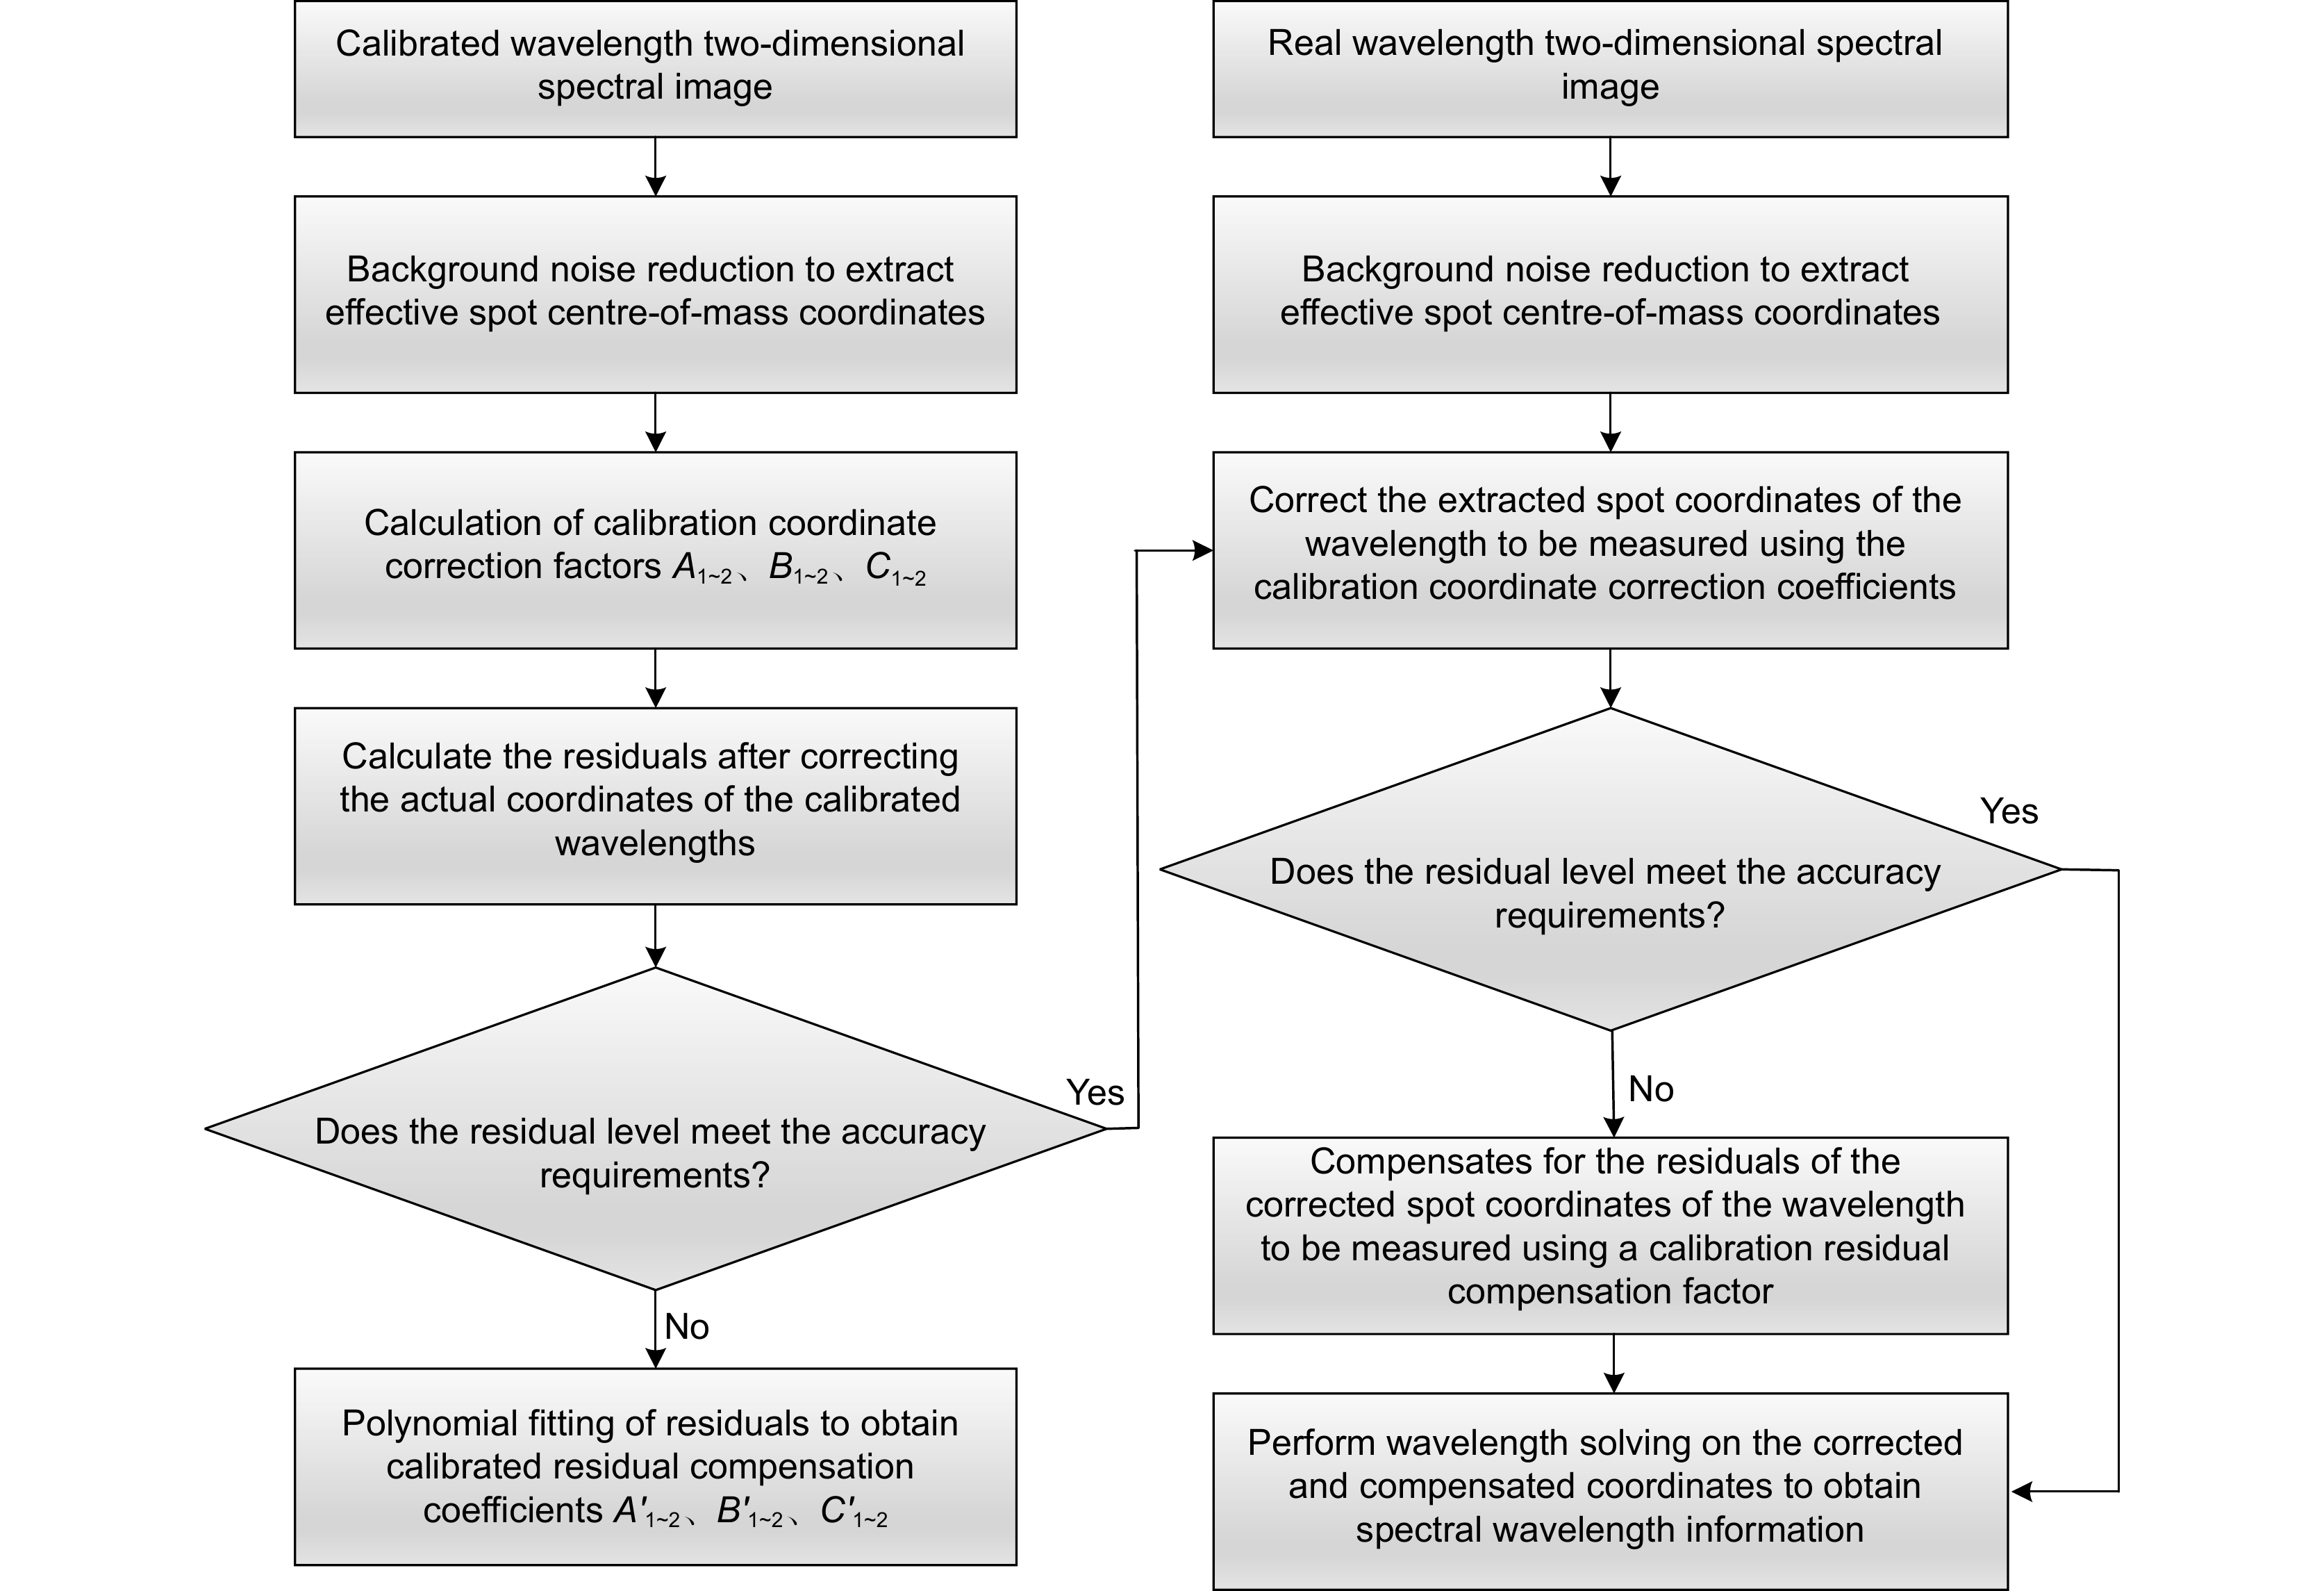
Overview: Echelle grating spectrometer uses a cross-dispersive optical structure for spectroscopy, forming a two-dimensional spectral image on the image plane. The reduction accuracy of the two-dimensional spectral image is to determine the accuracy of its wavelength measurement, but environmental changes, processing and mounting and other reasons will lead to the error between the actual spot coordinates and the theoretical spot coordinates, and the change of the spot coordinates will have a serious impact on the reduction accuracy of the spectral image. In this paper, a spectrum reduction algorithm for an echelle grating spectrometer based on least squares image coordinate correction is proposed. Firstly, the theoretical spot coordinates of the mercury lamp are recorded by simulation software, and then measurements are made using a calibrated mercury lamp light source, and the background noise reduction and morphological processing of the two-dimensional spectral map are carried out to obtain the center-of-mass coordinates of the actual spot of the wavelength of the mercury lamp, and then the coefficient matrix is constructed by utilizing the theoretical and actual image point coordinates, and then the coefficient matrix is solved from the obtained two-dimensional spectrum by the method of least squares. The coefficient matrix is solved by the least squares method to obtain the fitting coefficients of translation, scaling and rotation of the two-dimensional image plane, and then the polynomial fitting is used to reduce the influence of the residuals, realizing the image coordinate correction of the spot at different wavelengths, and then realize the accurate wavelength solution.
The experimental results show that the algorithm can effectively improve the spectral image reduction accuracy of the echelle grating spectrometer, and the center of mass extraction error is controlled at 0.6 image elements, and under the simulation of large mounting errors and environmental errors, the corrected coordinates of the measurements of the common elements deviate from their ideal coordinates by less than 0.6 image elements, which proves that the algorithm has high accuracy and provides a basis for the measurement of broad-band atomic emission spectra.
-

-
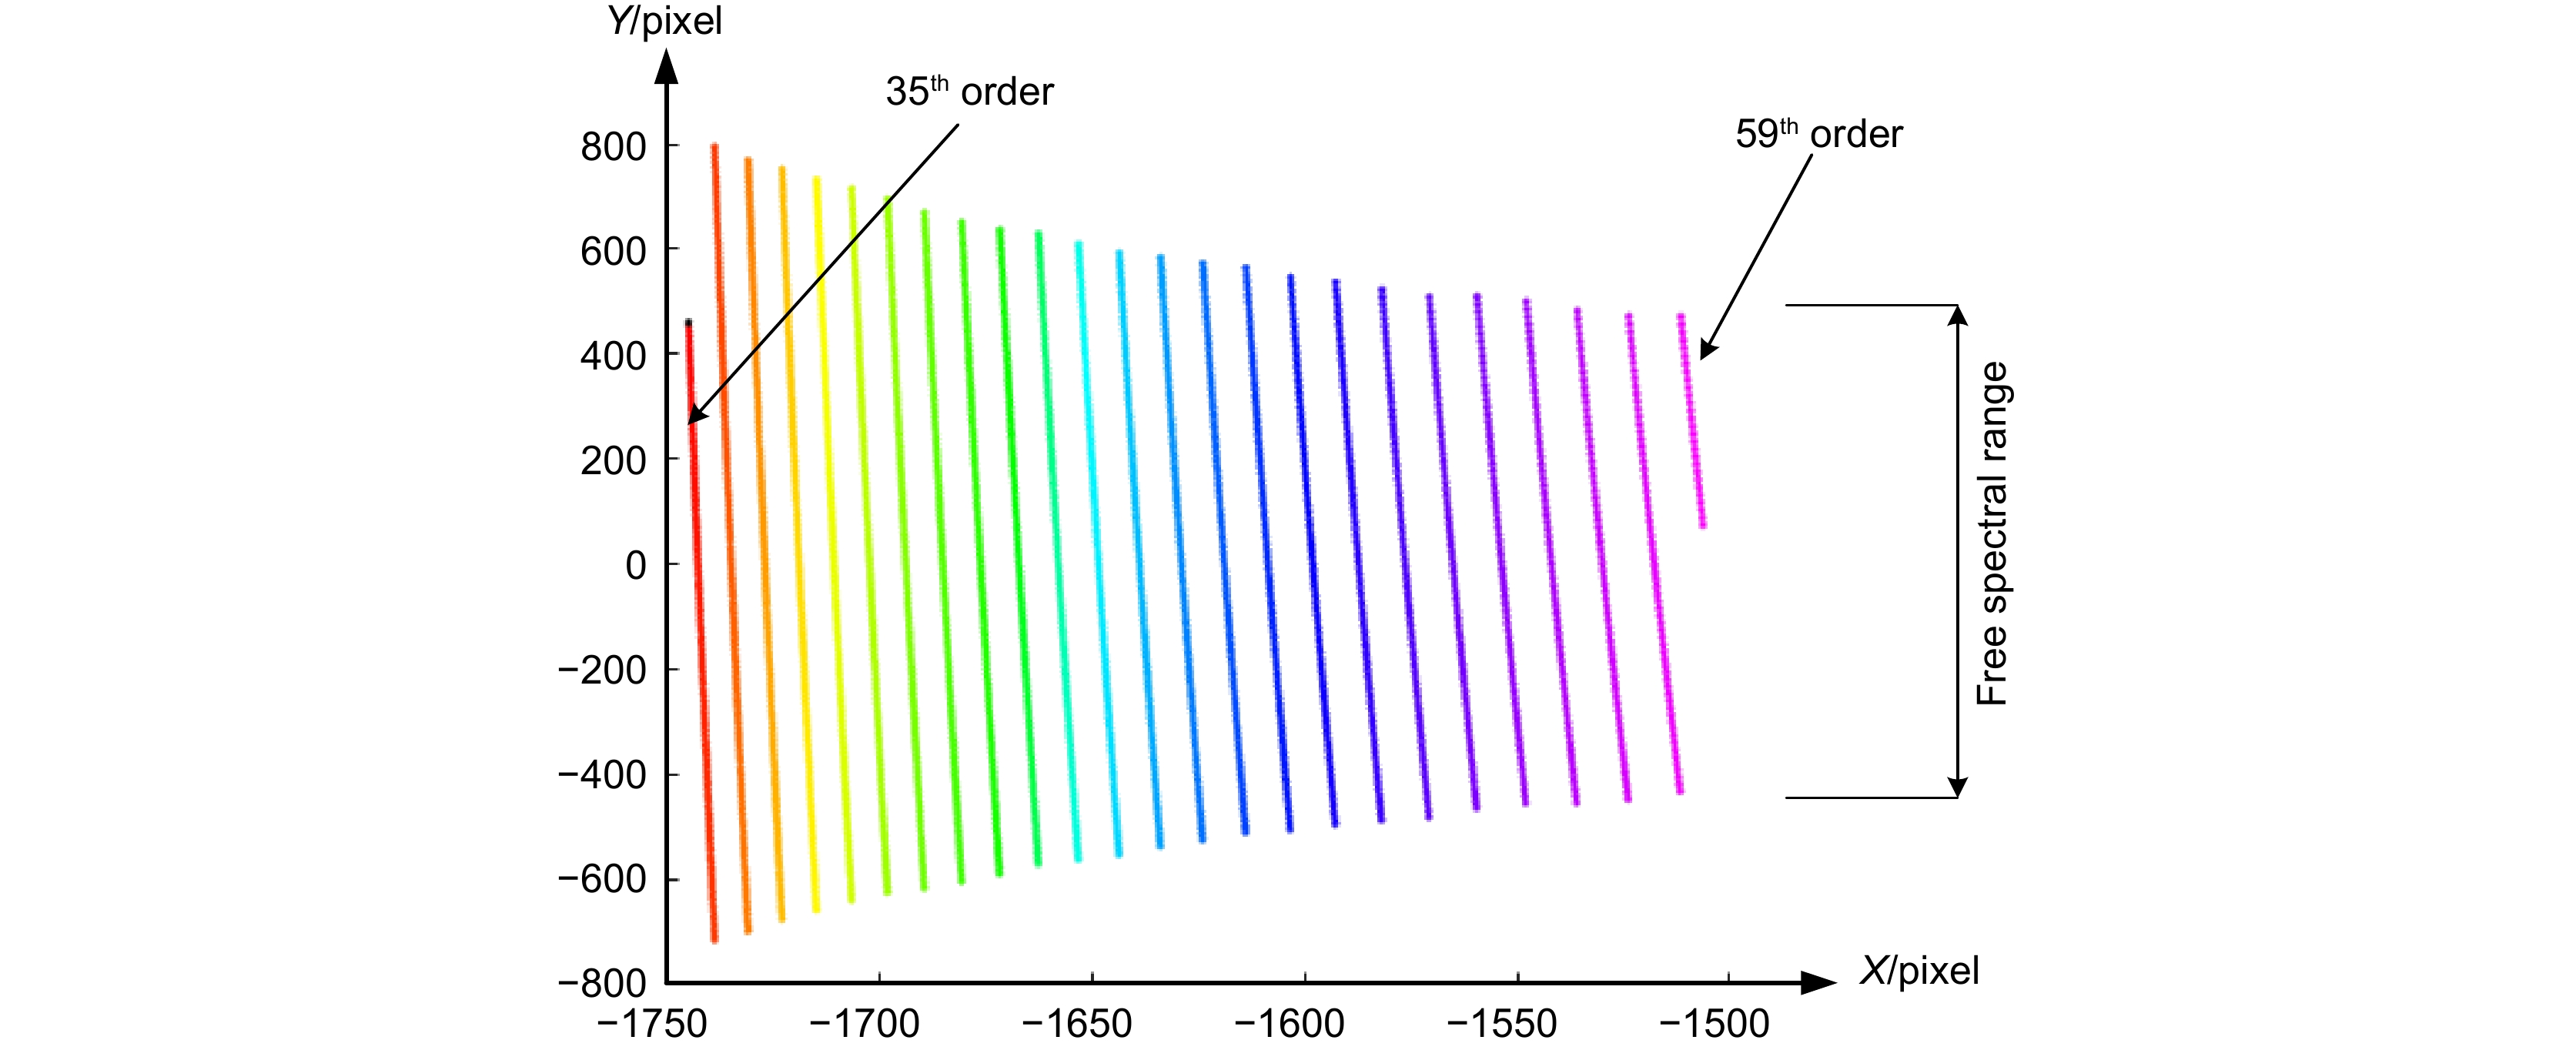
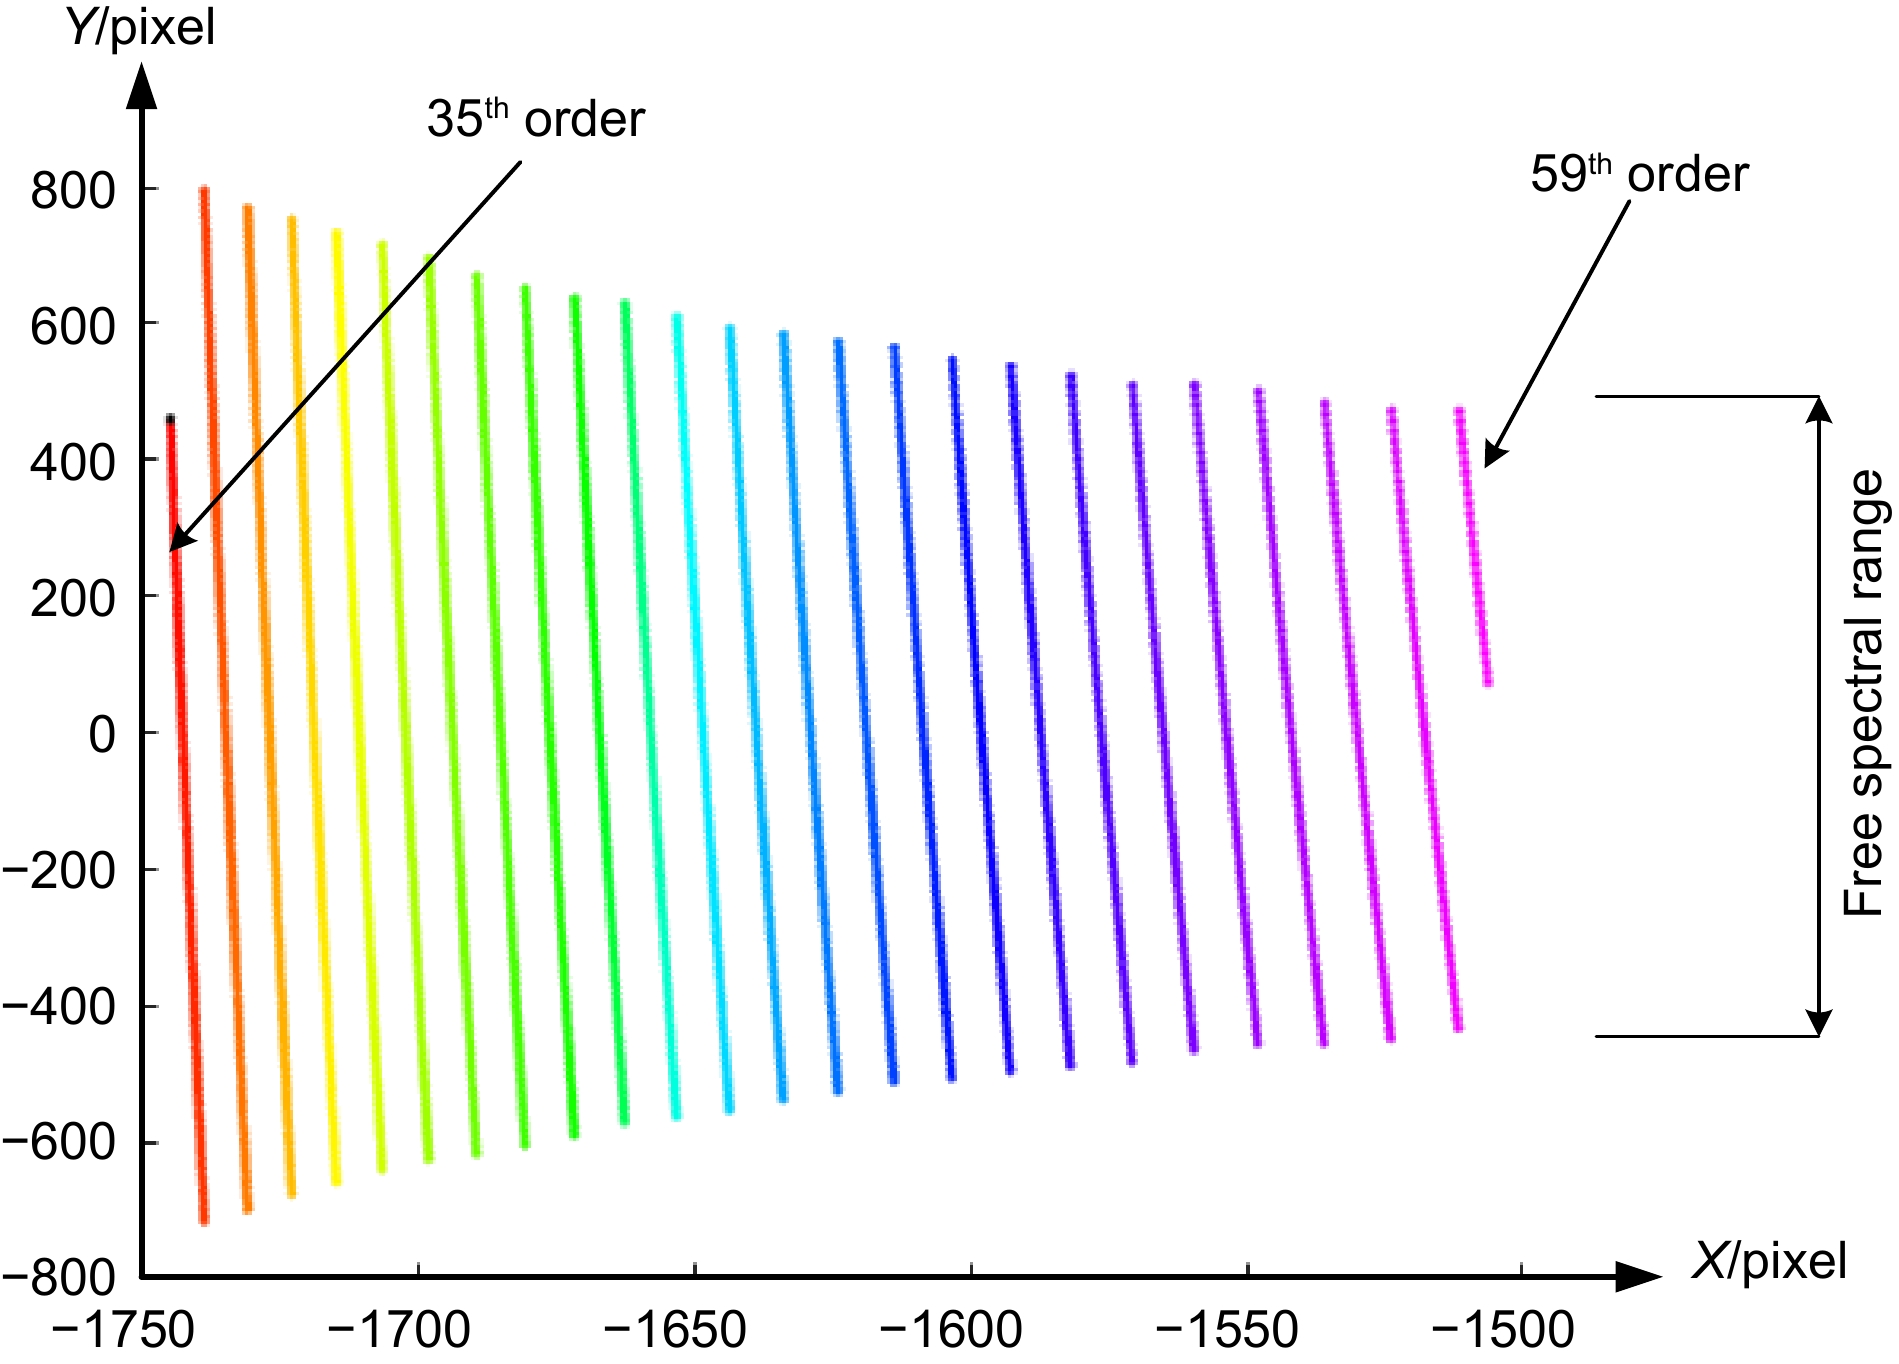
图 2 自由光谱区内中阶梯光谱仪二维光谱图
Figure 2. Two-dimensional spectrogram of the echelle grating spectrometer in the free spectrum region
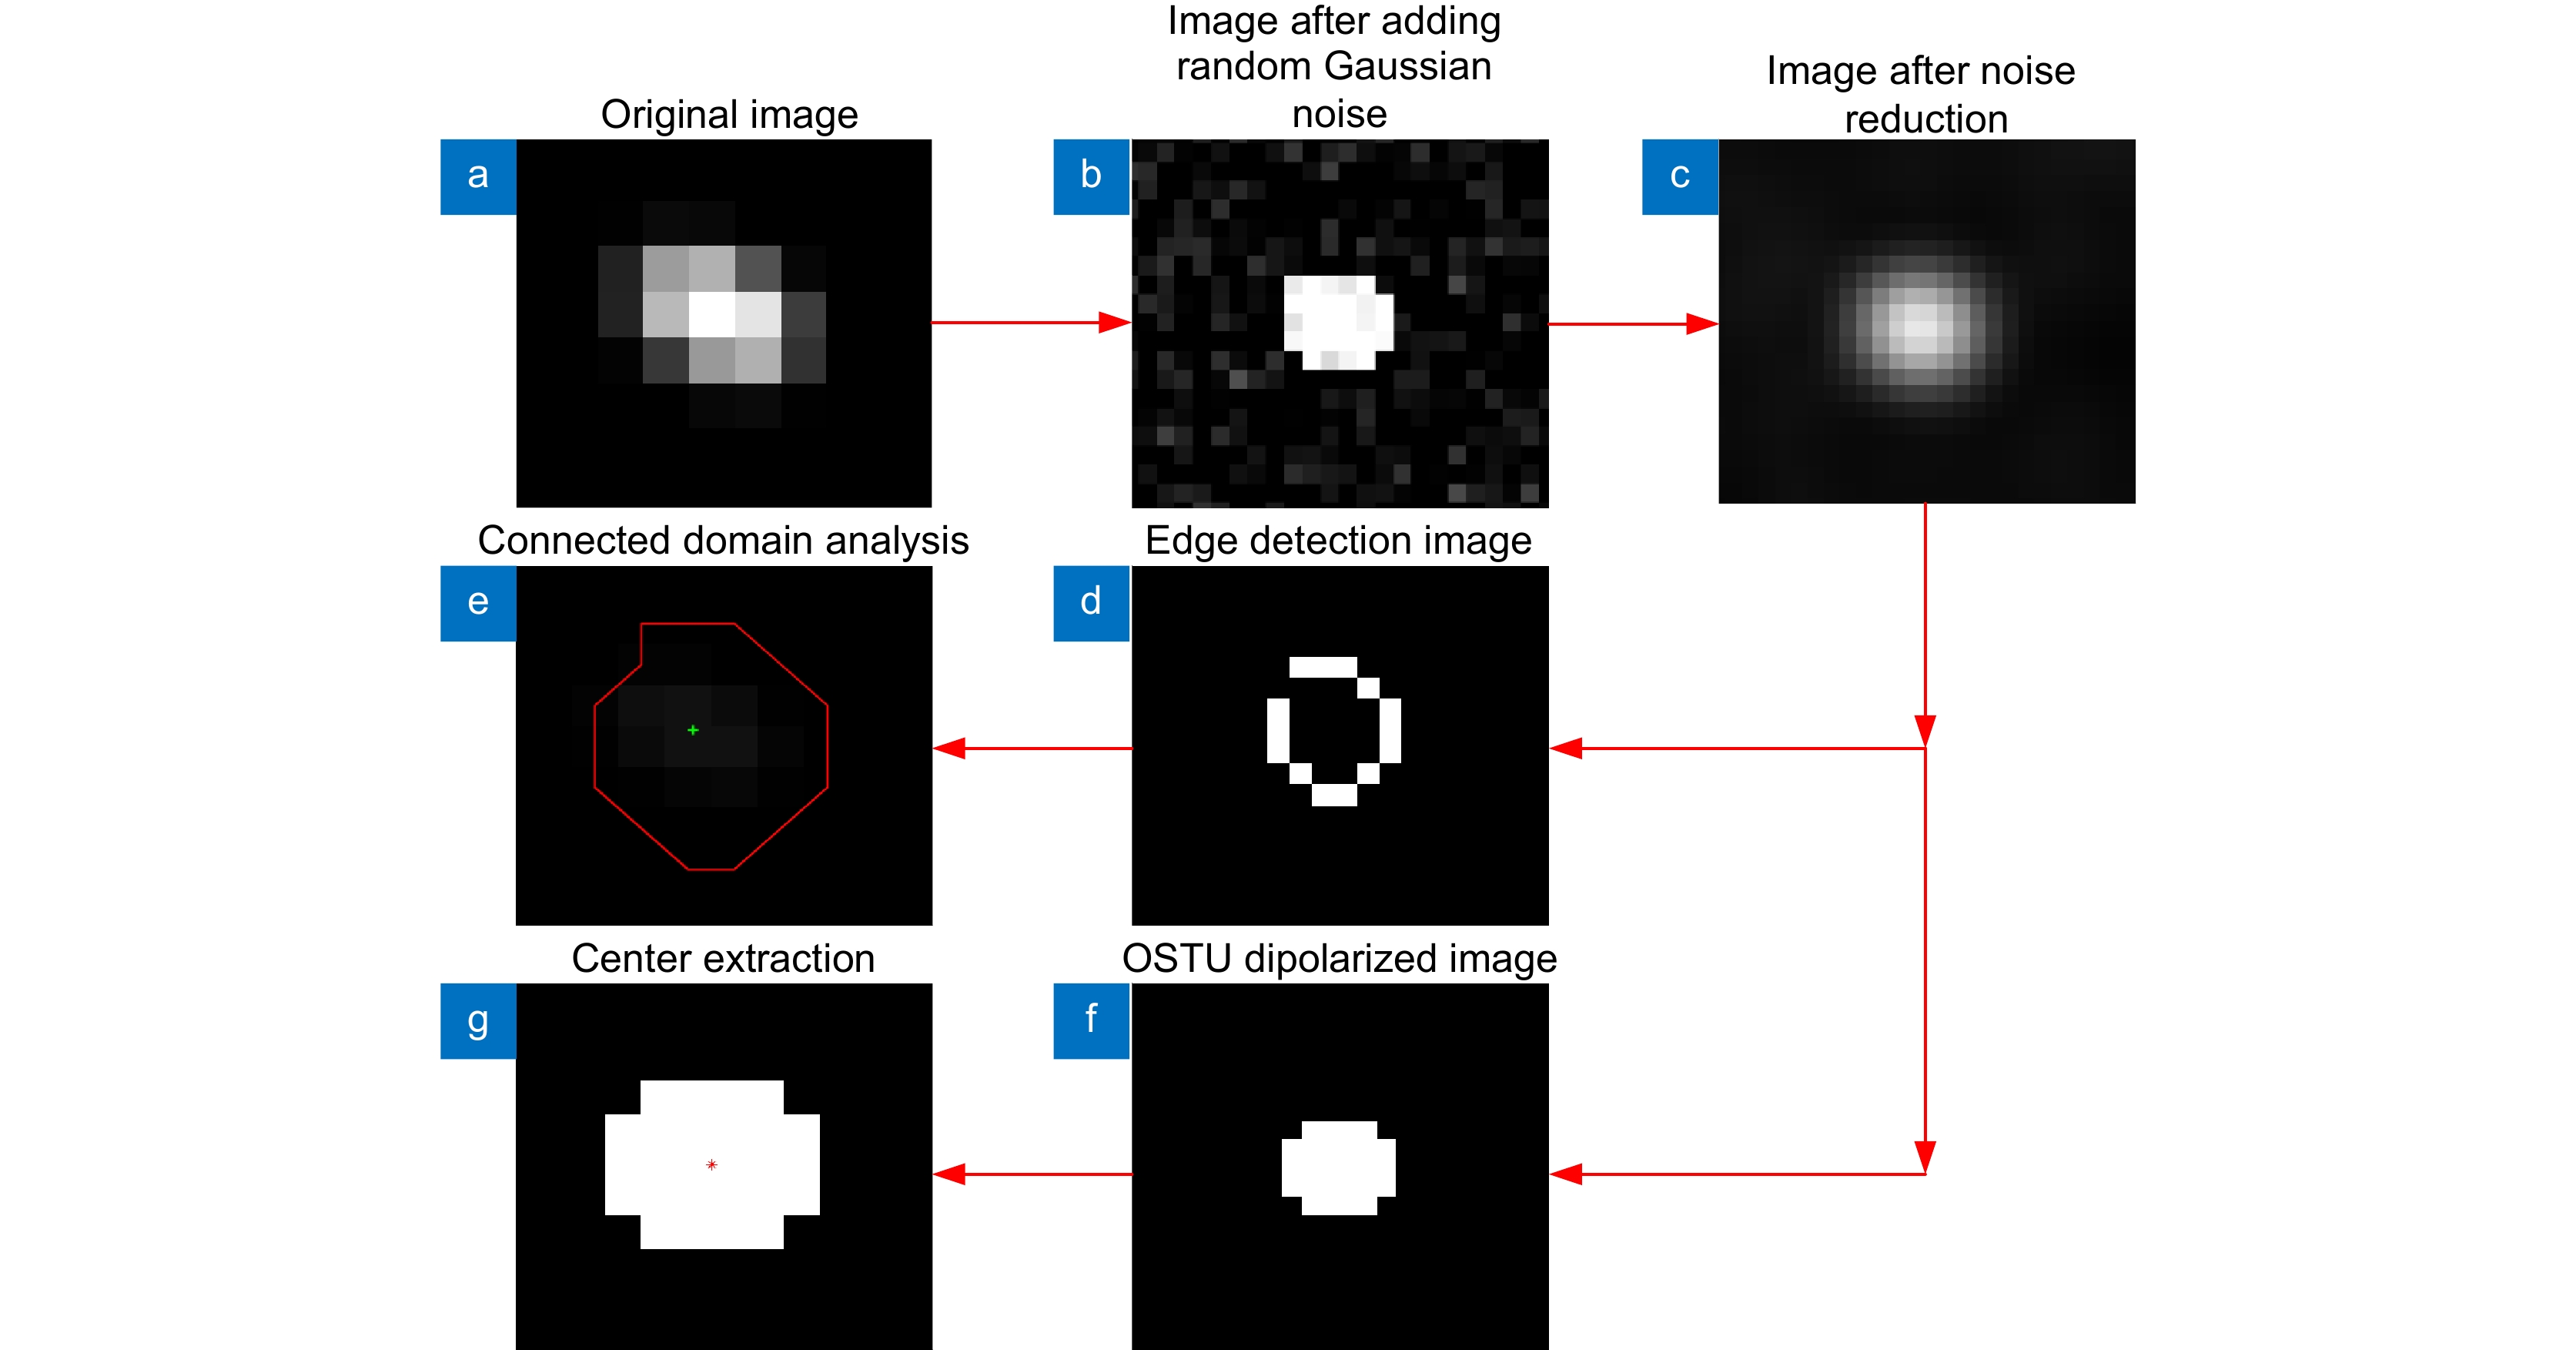
图 6 质心提取示意图。(a)原始图像;(b)添加高斯噪声;(c)背景降噪;(d)边缘提取;(e)连通域分析质心提取; (f) OSTU二极化;(g)灰度权重质心提取
Figure 6. Schematic diagram of center of mass extraction. (a) Original image; (b) Addition of Gaussian noise; (c) Background noise reduction; (d) Edge extraction; (e) Connected domain analysis center of mass extraction; (f) OSTU dipolarization; (g) Gray scale weighted center of mass extraction

图 7 汞氩灯光源成像二维光谱图
Figure 7. Two-dimensional spectrogram of mercury-argon light source imaging
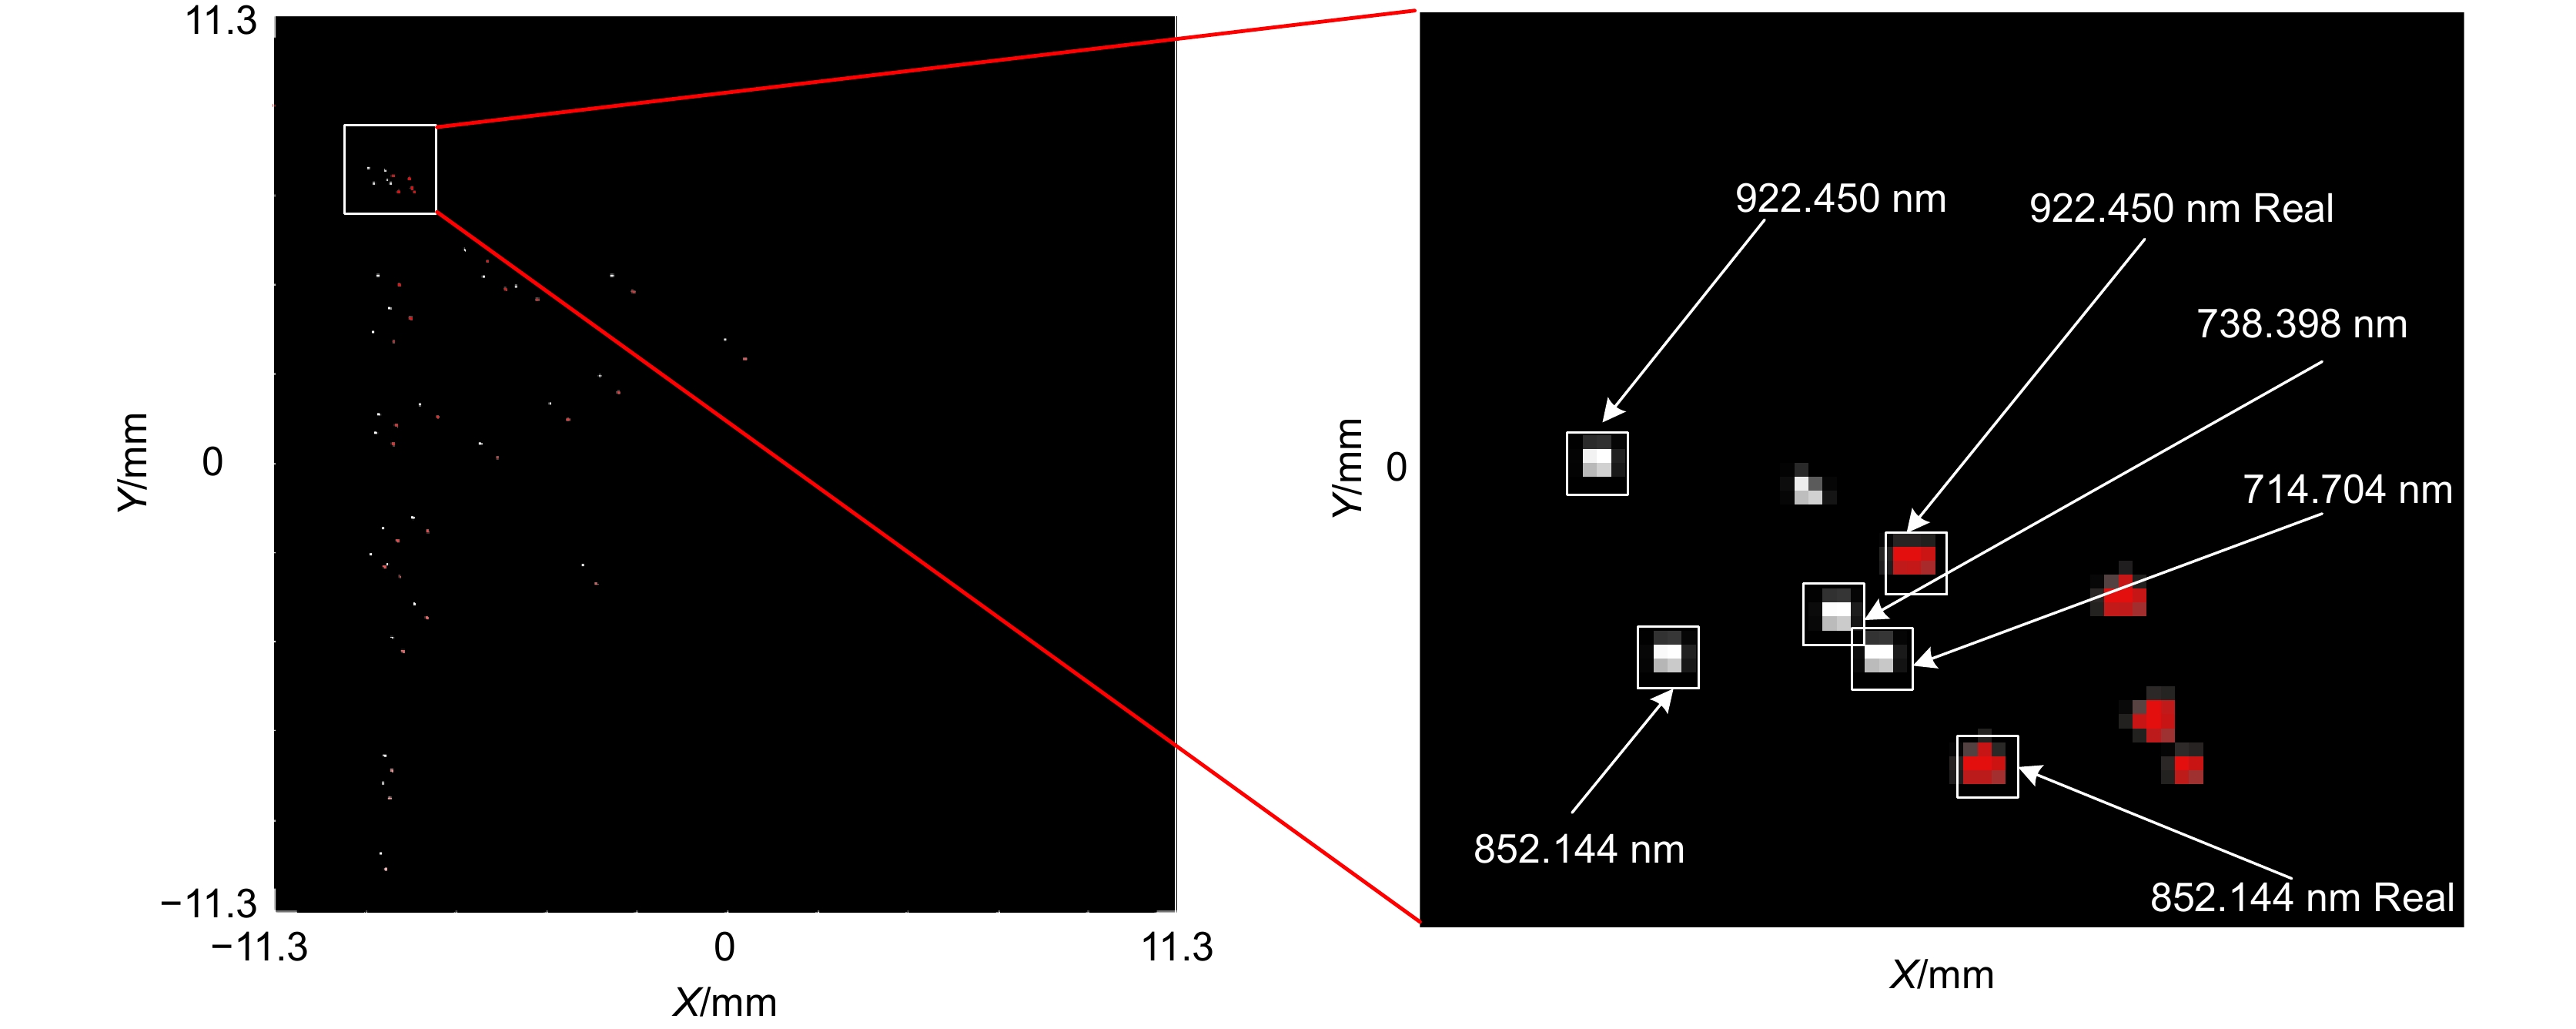
图 8 汞氩灯光源成像光谱对比图
Figure 8. Comparison of imaging spectrograms of mercury-argon light sources
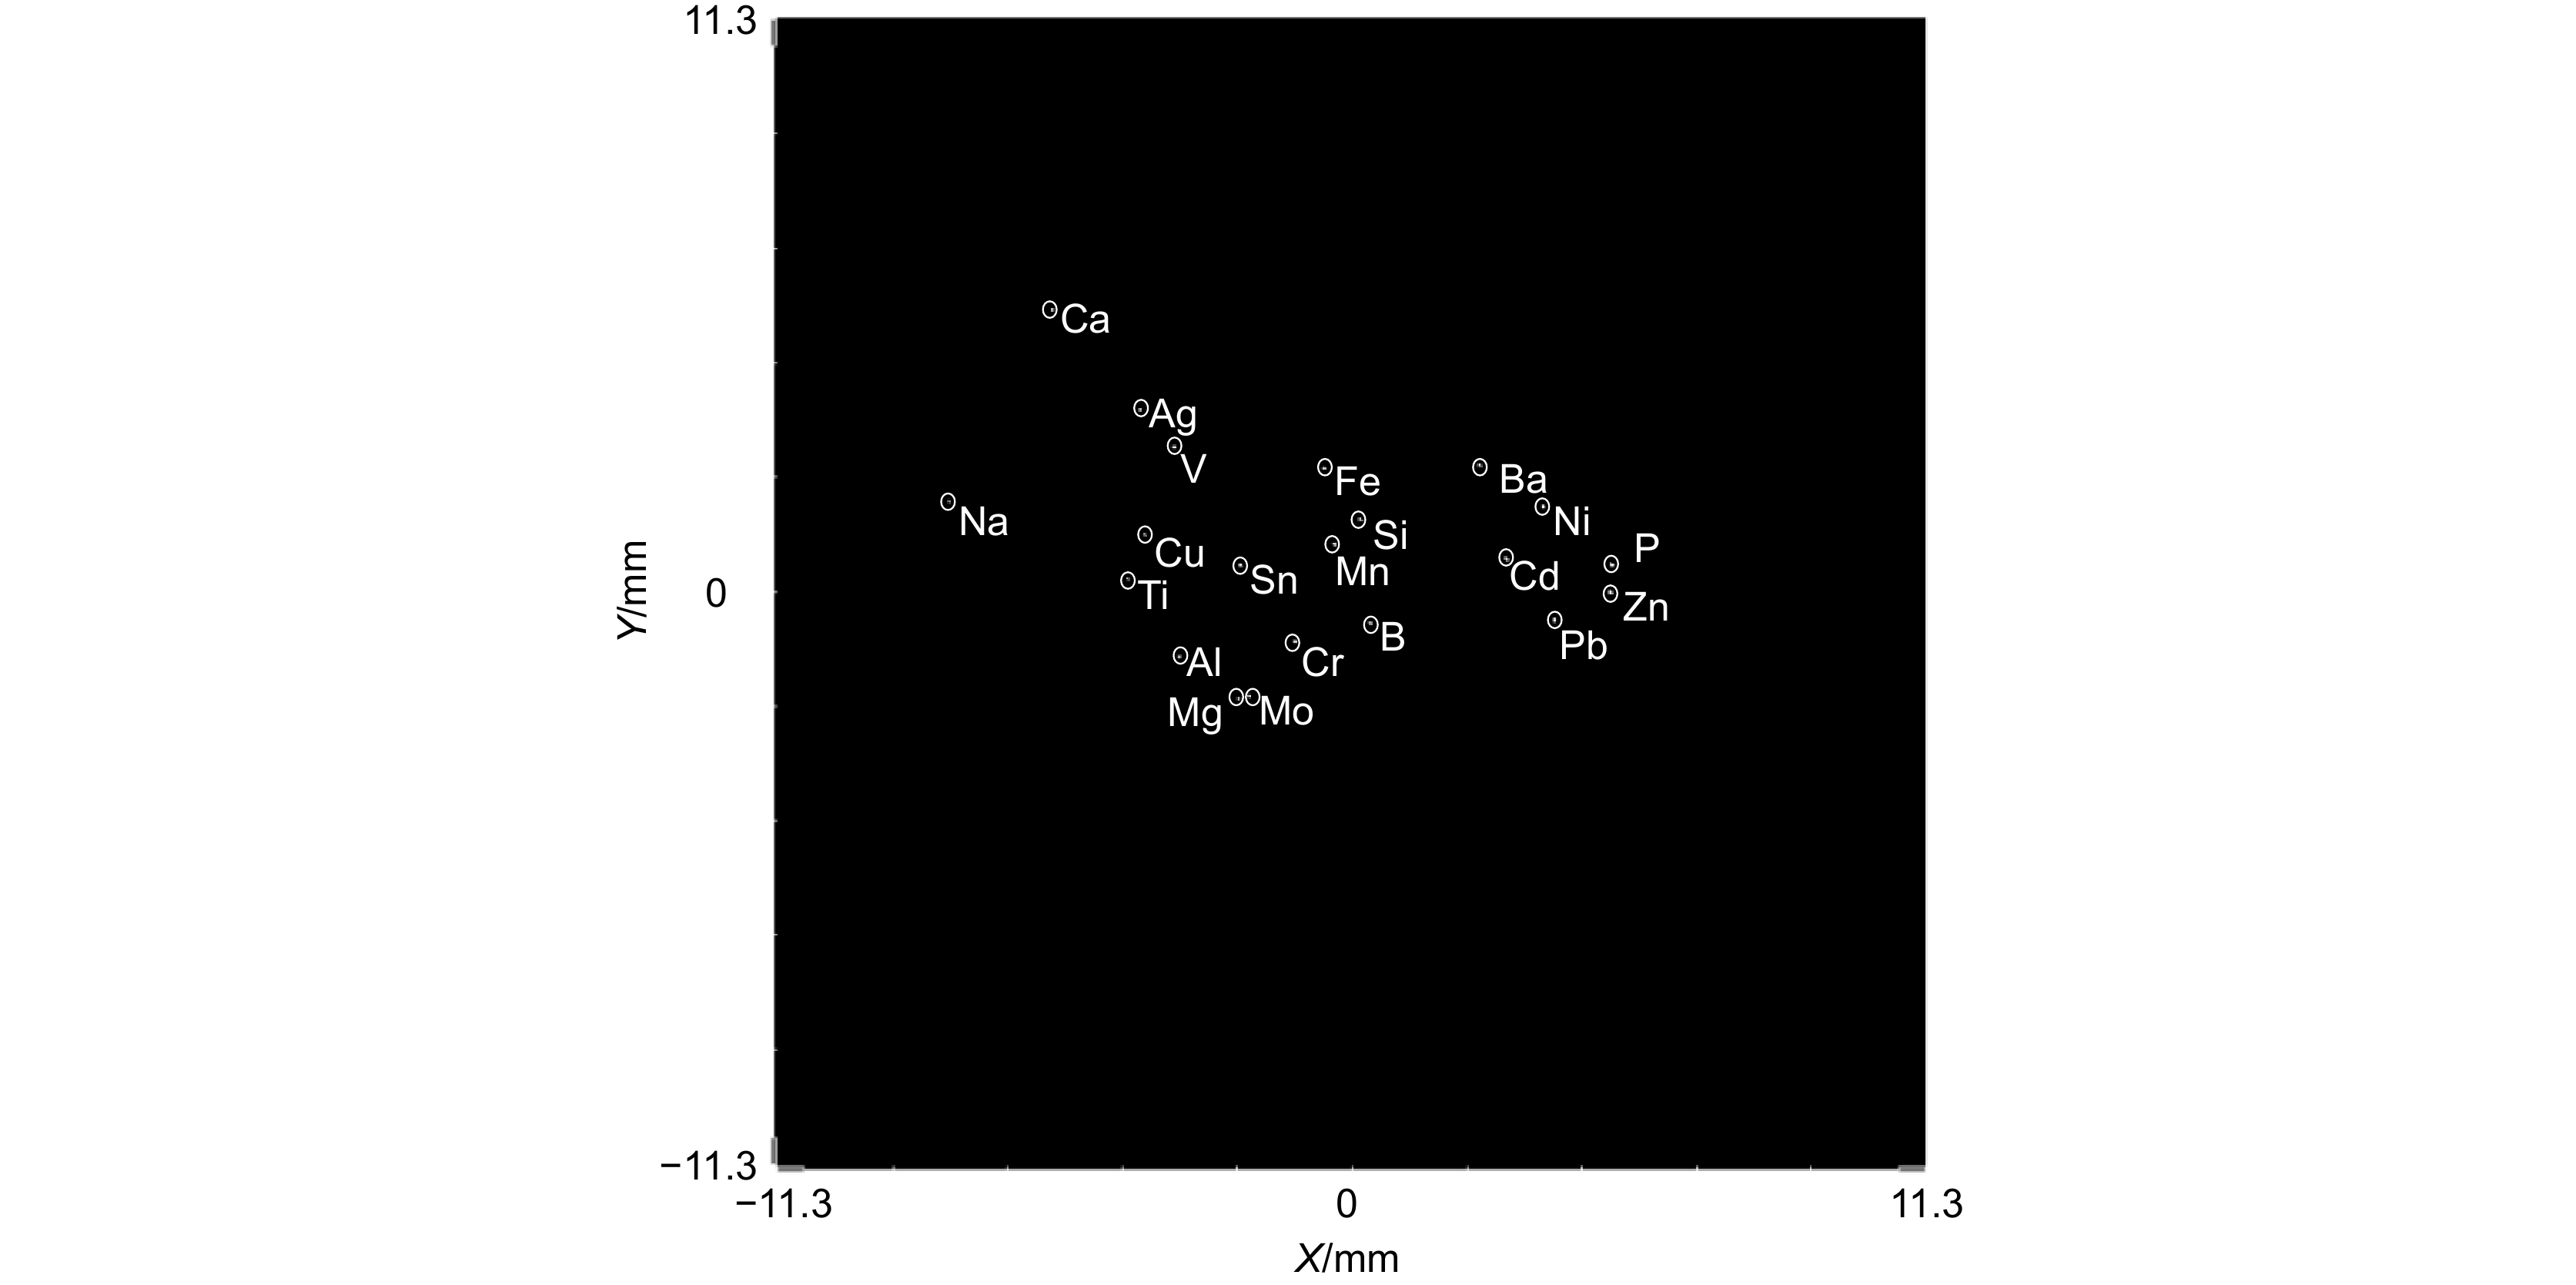
图 10 汞氩灯光源成像二维光谱图
Figure 10. Two-dimensional spectrogram of mercury-argon light source imaging
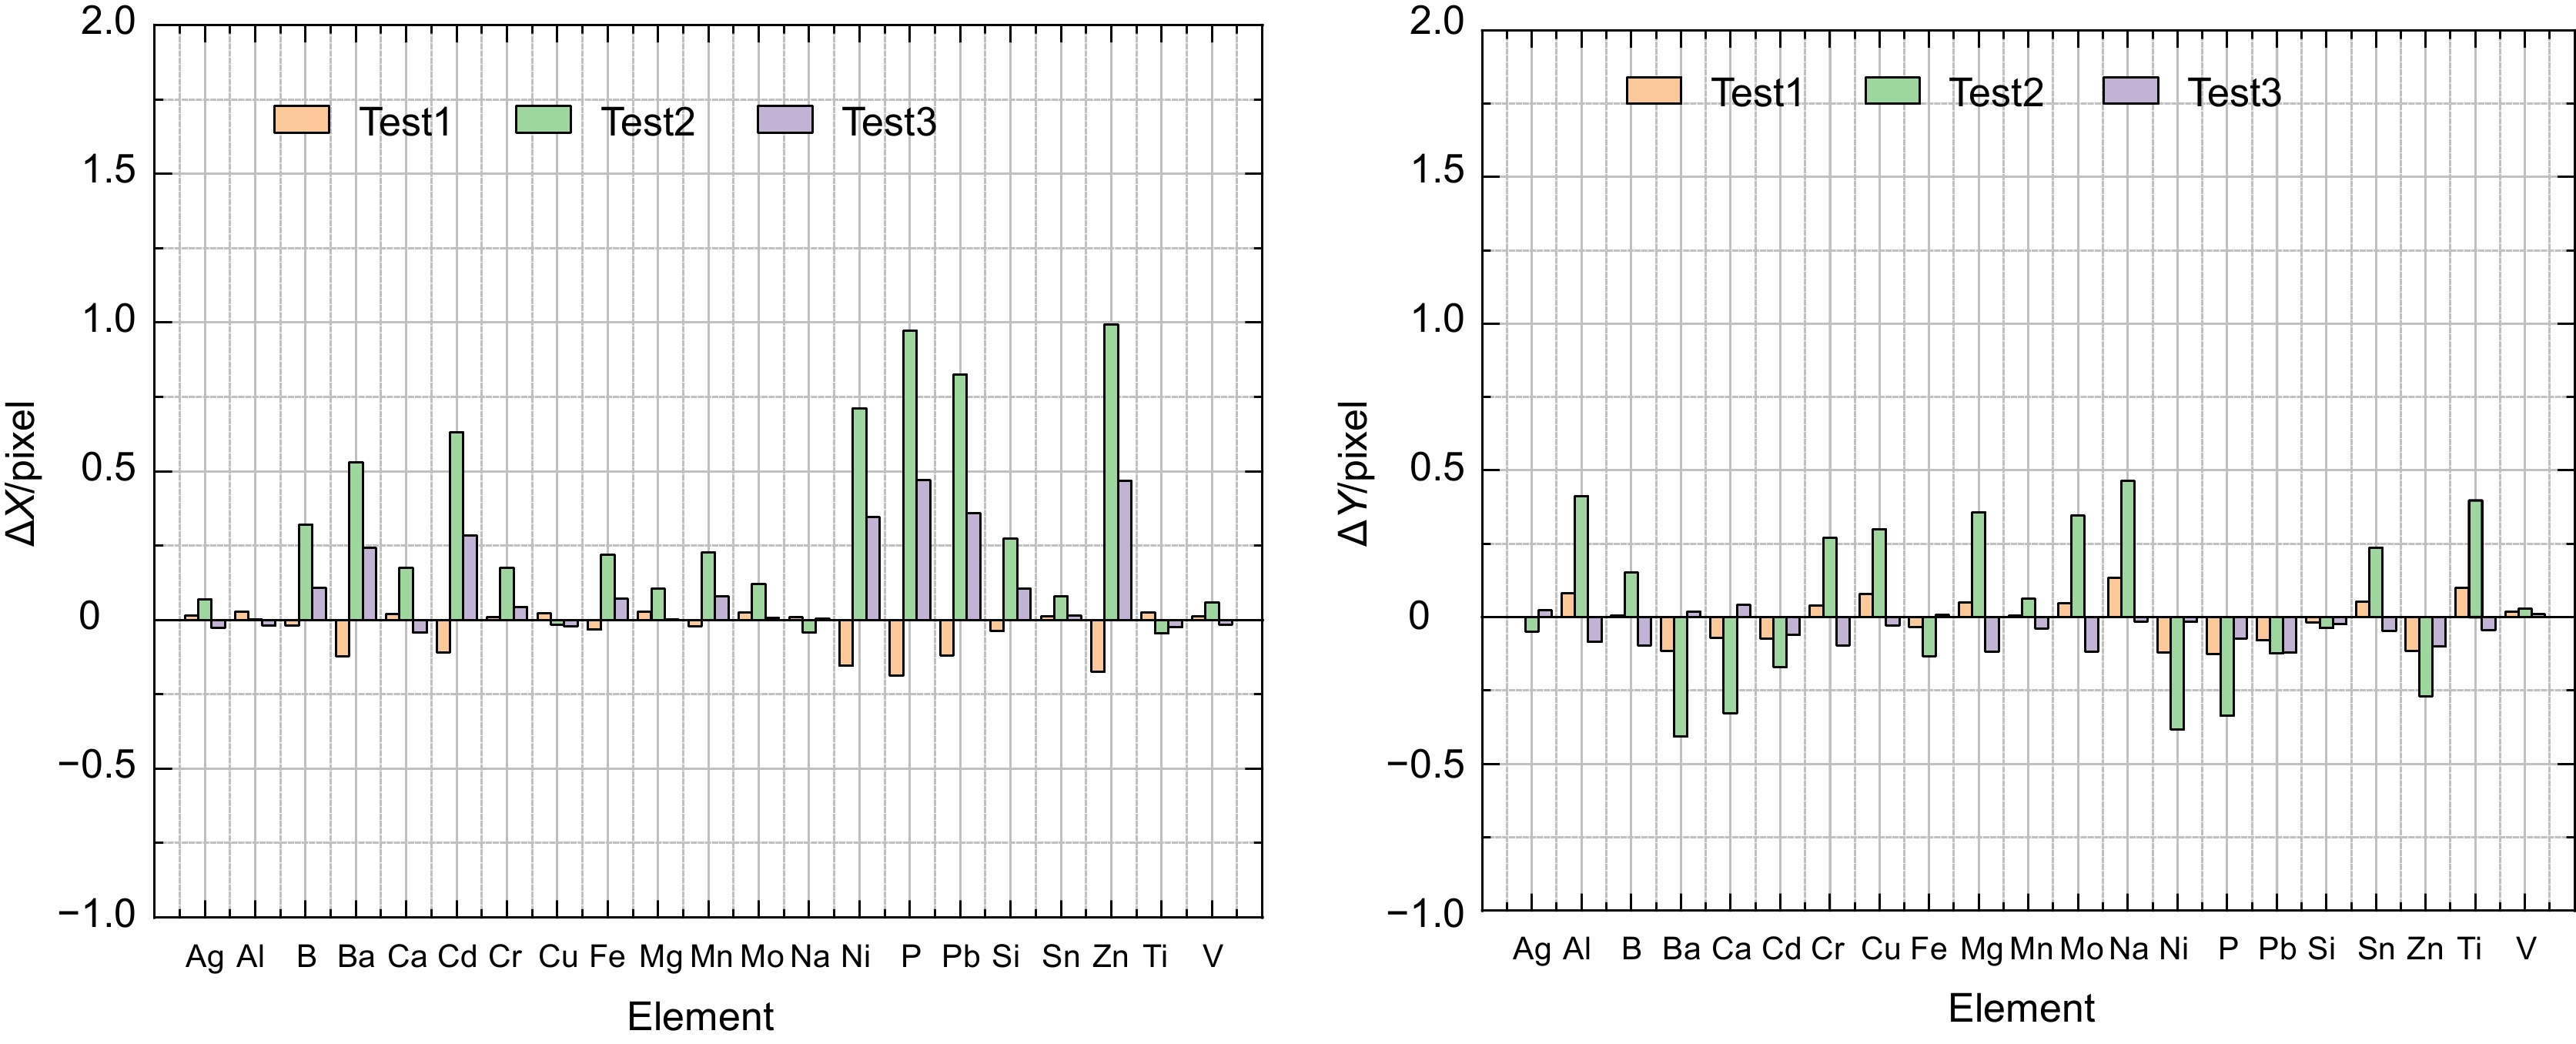
图 11 常见元素波长坐标修正残差
Figure 11. Common element wavelength coordinate correction residuals
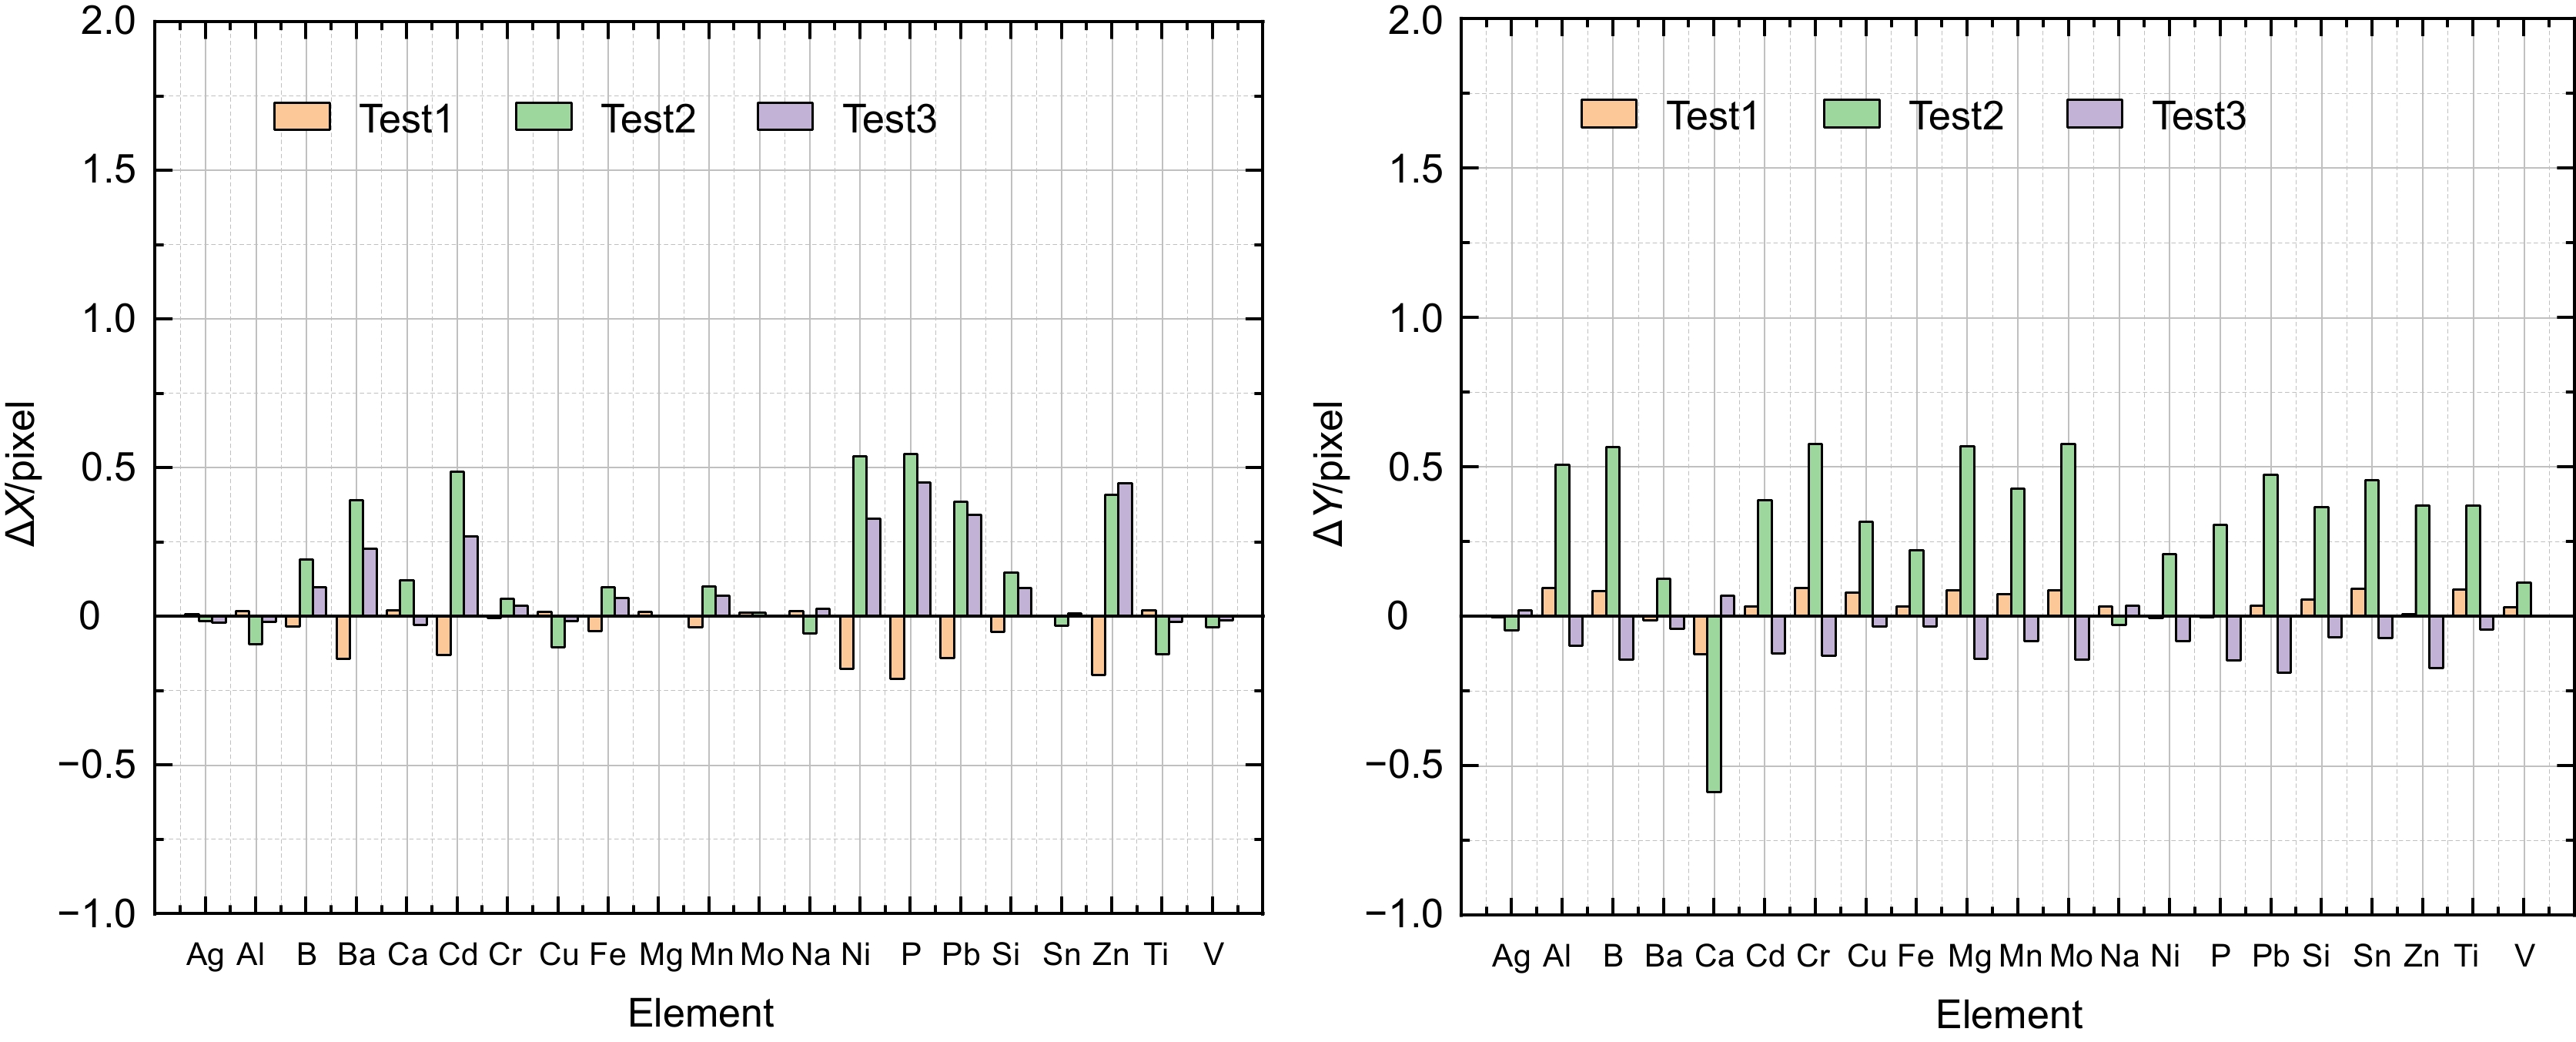
图 12 常见元素波长坐标残差补偿后最终偏差值
Figure 12. Final deviation after residual compensation of wavelength coordinates of common elements
表 1 中阶梯光谱仪设计参数
Table 1. Echelle grating spectrometer design parameters
Parameter Value Raster etching density/(l·mm−1) 79 Grating flashing angle/° 63 Grating deflection angle/° 7 Prismatic peak angle/° 18 Curvature of a spherical mirror/mm 300 Cylindrical lens curvature/mm 34.5 Detector full resolution 2048×2048 Detector pixel size/μm2 11×11  下载: 导出CSV
表 2 质心提取误差
Table 2. Center of mass extraction error
Error X/pixel Y/pixel Euclidean distance/pixel MAE 0.39511 0.37941 0.60333 MSE 0.18411 0.23683 0.42094 RMSE 0.42908 0.48665 0.64881 MAE (OSTU) 2.5928 1.3792 3.0394 MSE (OSTU) 7.0404 2.6216 9.662 RMSE (OSTU) 2.6534 1.6191 3.1084
下载: 导出CSV
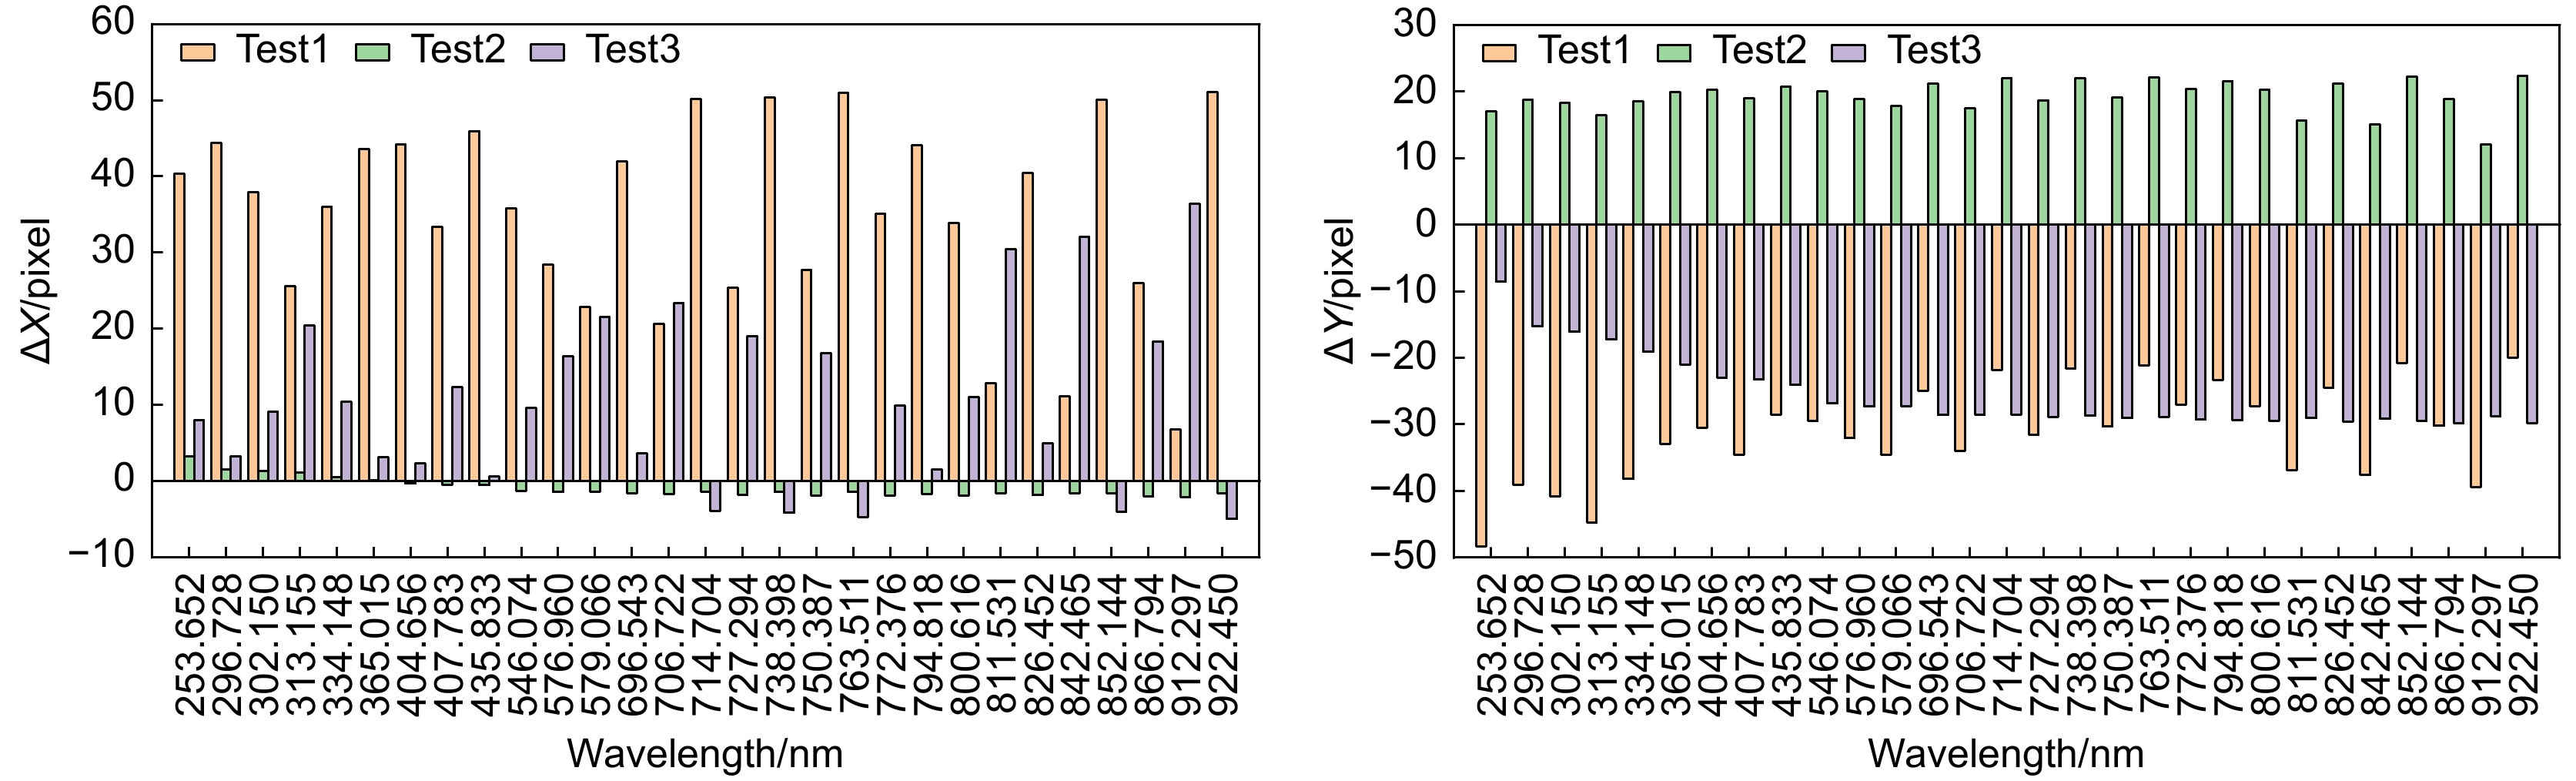
表 3 仿真实验光路参数误差值
Table 3. Simulation experiment optical path parameter error value
Factor Test1 Test2 Test3 Collimated spherical mirror deflection
angle difference/°0.1 0.2 −0.2 Grating flashing angle difference/° 0.2 0.2 −0.2 Grating deflection angle difference/° 0.2 −0.2 0.2 Prismatic peak angle difference/° 0.05 0.05 −0.05 Focusing spherical mirror deflection angle/° −0.1 0.1 −0.1 Image plane X coordinate difference/mm 0.5 −0.1 0.1 Image plane Y coordinate difference/mm −0.5 0.1 0.1 Image plane Z coordinate difference/mm 2.0 −1.0 2 Angle of rotation of image plane difference/° 1.5 0 −1.5 Temperature difference/℃ 10.0 −10.0 10.0 Barometric pressure difference/ATM 0.5 0 −0.5
下载: 导出CSV
表 4 汞氩灯特征波长光谱信息
Table 4. Spectral information on characteristic wavelengths of mercury-argon lamps
Wavelength/nm Order of diffraction X position/pixel Y position/pixel Wavelength/nm Order of diffraction X position/pixel Y position/pixel 253.652 88 −1.0108 287.6266 727.294 31 −769.6398 −229.8145 296.728 75 −259.1705 433.7794 738.398 30 −768.3944 653.3849 302.150 74 −285.9167 203.6792 750.387 30 −778.3806 −147.5455 313.155 72 −324.6694 −231.9005 763.511 29 −774.8637 674.6637 334.148 67 −399.4394 138.8264 772.376 29 −787.3103 113.8959 365.015 61 −475.8133 409.3228 794.818 28 −790.2125 433.5014 404.656 55 −549.4312 430.7239 800.616 28 −794.6037 72.0627 407.783 55 −557.1198 47.3395 811.531 28 −775.0149 −670.483 435.833 51 −591.7942 492.492 826.452 27 −800.1515 303.6997 546.074 41 −694.7505 136.294 842.465 27 −778.8817 −732.2836 576.960 39 −710.6427 −123.4383 852.144 26 −798.1824 645.4346 579.066 39 −706.8637 −320.3302 866.794 26 −806.3448 −207.1703 696.543 32 −762.6245 358.3138 912.297 25 −783.509 −894.4498 706.722 32 −757.8462 −397.779 922.450 24 −811.9811 681.0741 714.704 31 −761.3504 645.1947
下载: 导出CSV
表 5 谱图坐标修正拟合系数
Table 5. Spectral coordinate correction fitting factor
Factor Test1 Test2 Test3 A1 0.9986 0.9939 0.9961 B1 −0.0279 0.0002 0.0261 C1 −33.6899 −2.9814 −15.0959 A2 0.0290 0.0043 −0.0262 B2 0.9876 0.9949 0.9993 C2 50.1140 −15.7932 8.9989
下载: 导出CSV
表 6 常见元素光谱坐标
Table 6. Spectral coordinates of common elements
Wavelength/nm Type of elements X position/pixel Y position/pixel Wavelength/nm Type of elements X position/pixel Y position/pixel 328.0 Ag −379.2747 325.992 281.6 Mo −183.6679 −186.0624 308.2 Al −308.3616 −116.4983 588.9 Na −719.3371 160.7838 249.7 B 32.5311 −56.4979 221.6 Ni 341.3734 153.1065 230.4 Ba 227.3107 226.7227 213.6 P 464.375 47.4839 396.8 Ca −534.824 506.7872 220.3 Pb 361.3903 −50.9932 226.5 Cd 275.5752 57.838 251.6 Si 14.9795 128.6809 267.7 Cr −102.4702 −88.747 283.9 Sn −199.6097 47.3144 324.7 Cu −369.9202 101.6626 213.8 Zn 461.5029 −0.894 259.9 Fe −49.8481 220.8933 334.9 Ti −401.2032 23.8482 285.2 Mg −202.6585 −192.7362 310.2 V −317.9437 258.7749 257.6 Mn −32.7989 85.962
下载: 导出CSV
表 7 残差多项式拟合系数
Table 7. Residual polynomial fitting coefficients
Factor Test1 Test2 Test3 A1 3.373×10⁻² 3.361×10⁻² 9.772×10⁻⁴ B1 −8.157×10⁻⁵ −1.153×10⁻⁴ −2.517×10⁻⁶ C1 2.640×10⁻⁹ 6.465×10⁻⁹ 1.724×10⁻¹⁰ A2 −7.852×10⁻² 1.142×10⁻¹ −1.312×10⁻² B2 2.221×10⁻⁴ −3.411×10⁻⁴ 3.365×10⁻⁵ C2 −9.151×10⁻⁹ 1.204×10⁻⁹ −2.296×10⁻⁹
下载: 导出CSV
-
参考文献
[1] Keliher P N, Wohlers C C. Echelle grating spectrometers in analytical spectrometry[J]. Anal Chem, 1976, 48(3): 333A−340A. doi: 10.1021/ac60367a782
[2] Ma K Q, Chen K X, Zhu N, et al. High-resolution compact on-chip spectrometer based on an echelle grating with densely packed waveguide array[J]. IEEE Photonics J, 2019, 11(1): 4900107. doi: 10.1109/JPHOT.2018.2888592
[3] García M, Aguirre M A, Canals A. A new multinebulizer for spectrochemical analysis: wear metal determination in used lubricating oils by on-line standard dilution analysis (SDA) using inductively coupled plasma optical emission spectrometry (ICP OES)[J]. J Anal At Spectrom, 2020, 35(2): 265−272. doi: 10.1039/C9JA00255C
[4] Cahyadi D, Susilowati E, Arsyansyah M, et al. Development of a rapid-test method for the determination of calcium, zinc, phosphorus, and sulfur in automotive engine oil by WD-XRF (wavelength dispersive x-ray fluorescent)[J]. IOP Conf Ser Mater Sci Eng, 2020, 980: 012050. doi: 10.1088/1757-899X/980/1/012050
[5] Amais R S, Amaral C D B, Fialho L L, et al. Determination of P, S and Si in biodiesel, diesel and lubricating oil using ICP-MS/MS[J]. Anal Methods, 2014, 6(13): 4516−4520. doi: 10.1039/C4AY00279B
[6] Li H L, Wang H B, Huang Y C, et al. Plasma characteristics and quantitative analysis of Pb and Ni in soil based on LIBS technology[J]. Optoelectron Lett, 2020, 16(2): 143−148. doi: 10.1007/s11801-020-9189-8
[7] Vinić M, Aruffo E, Andreoli F, et al. Quantification of heavy metals in oils with µL volume by laser induced breakdown spectroscopy and minimazing of the matrix effect[J]. Spectrochim Acta Part B At Spectrosc, 2020, 164: 105765. doi: 10.1016/j.sab.2020.105765
[8] Nevejans D, Neefs E, Van Ransbeeck E, et al. Compact high-resolution spaceborne echelle grating spectrometer with acousto-optical tunable filter based order sorting for the infrared domain from 2.2 to 4.3 μm[J]. Appl Opt, 2006, 45(21): 5191−5206. doi: 10.1364/AO.45.005191
[9] 崔涛, 尹禄, 梁培, 等. 中阶梯光栅光谱仪谱图还原技术发展与展望(特邀)[J]. 激光与光电子学进展, 2024, 61(3): 0330003. doi: 10.3788/LOP231373
Cui T, Yin L, Liang P, et al. Development and prospects of spectral reduction technology of echelle spectrometer (Invited)[J]. Laser Optoelectron Prog, 2024, 61(3): 0330003. doi: 10.3788/LOP231373
[10] Liu K L, Hieftje G M. Investigation of wavelength calibration for an echelle cross-dispersion spectrometer[J]. J Anal At Spectrom, 2003, 18(10): 1177−1184. doi: 10.1039/b300981p
[11] 宁春丽, 齐向东, 陈少杰, 等. 轻小型中阶梯光栅光谱仪光学设计及性能分析[J]. 光谱学与光谱分析, 2012, 32(12): 3406−3410. doi: 10.3964/j.issn.1000-0593(2012)12-3406-05
Ning C L, Qi X D, Chen S J, et al. Optical design and performance analysis of light and small echelle spectrograph[J]. Spectrosc Spectral Anal, 2012, 32(12): 3406−3410. doi: 10.3964/j.issn.1000-0593(2012)12-3406-05
[12] Finkelstein N A. The measurement of wavelength in echelle spectra[J]. J Opt Soc Am, 1953, 43(2): 90−96. doi: 10.1364/JOSA.43.000090
[13] McNeill J J. Wavelength measurement in echelle spectra[J]. J Opt Soc Am, 1959, 49(5): 441−444. doi: 10.1364/JOSA.49.000441
[14] 朱继伟, 孙慈, 杨晋, 等. 基于多项式拟合的中阶梯光栅光谱仪谱图还原[J]. 光学 精密工程, 2020, 28(8): 1627−1633. doi: 10.3788/OPE.20202808.1627
Zhu J W, Sun C, Yang J, et al. Spectrogram reduction for echelle grating spectrometer based on Polynomial fitting[J]. Opt Precis Eng, 2020, 28(8): 1627−1633. doi: 10.3788/OPE.20202808.1627
[15] 唐玉国, 陈少杰, 巴音贺希格, 等. 中阶梯光栅光谱仪的谱图还原与波长标定[J]. 光学 精密工程, 2010, 18(10): 2130−2136. doi: 10.3788/OPE.20101810.2130
Tang Y G, Chen S J, Bayanheshig, et al. Spectral reducing of cross-dispersed echelle spectrograph and its wavelength calibration[J]. Opt Precis Eng, 2010, 18(10): 2130−2136. doi: 10.3788/OPE.20101810.2130
[16] 傅骁. LIBS中阶梯光栅光谱仪实现技术及数据处理算法研究[D]. 天津: 天津大学, 2018. https://doi.org/10.27356/d.cnki.gtjdu.2018.000097.
Fu X. Implementation of LIBS echelle spectrometer and research on data processing method[D]. Tianjin: Tianjin University, 2018. https://doi.org/10.27356/d.cnki.gtjdu.2018.000097.
[17] 崔涛, 尹禄, 孙亚楠, 等. 基于全像面拟合的中阶梯光栅光谱仪谱图还原算法[J]. 中国激光, 2024, 51(8): 0811003. doi: 10.3788/CJL231469
Cui T, Yin L, Sun Y N, et al. Spectral reduction algorithm for echelle spectrometer based on full-field fitting[J]. Chin J Lasers, 2024, 51(8): 0811003. doi: 10.3788/CJL231469
[18] 郑麒麟, 文龙, 陈沁. 基于散斑检测的微型计算光谱仪研究进展[J]. 光电工程, 2021, 48(3): 200183. doi: 10.12086/oee.2021.200183
Zheng Q L, Wen L, Chen Q. Research progress of computational microspectrometer based on speckle inspection[J]. Opto-Electron Eng, 2021, 48(3): 200183. doi: 10.12086/oee.2021.200183
[19] Zheng Z H, Zhu S K, Chen Y, et al. Towards integrated mode-division demultiplexing spectrometer by deep learning[J]. Opto-Electron Sci, 2022, 1(11): 220012. doi: 10.29026/oes.2022.220012
[20] 王玉, 曾延安, 郑海霆, 等. 基于成像光谱仪的光亮度精确测量方法研究[J]. 激光技术, 2024, 48(2): 166−170. doi: 10.7510/jgjs.issn.1001-3806.2024.02.004
Wang Y, Zeng Y A, Zheng H T, et al. Study on luminance accurate measurement method based on imaging spectrometer[J]. Laser Technol, 2024, 48(2): 166−170. doi: 10.7510/jgjs.issn.1001-3806.2024.02.004
-
访问统计

 点击扫一扫
点击扫一扫

图(13)
表(7)
计量
- 文章访问数:
- PDF下载数:
- 施引文献: 0


