
 E-mail Alert
 RSS
RSS
-
摘要
为解决彩色电泳电子纸因粘滞阻力等引起的显示颜色饱和度低、边缘模糊等问题,本文提出基于HSL空间的彩色电子纸边缘增强误差扩散算法,以提高图像显示质量。该算法首先将去噪图像利用边缘检测算子得到边缘增强图像,结合边缘增强图像像素邻域平均灰度、像素与邻域灰度差异和像素邻域相似度得到新RGB图像像素值。接着,新RGB图像通过阈值处理过程得到16色阶RGB图像。最后,16色阶RGB图像转换到HSL空间,建立HSL和RGB色彩空间的转换模型,根据像素点的亮度和饱和度计算出调整因子,从而增强RGB图像饱和度。该算法与传统的误差扩散算法相比,信噪比PSNR提高了3.9%~26.7%,UCIQE提高了10.1%~48.2%,相似度SSIM提高了13.2%~25.4%。主观评价参考ITU-R BT.500-1标准设计实验计算Z得分,最终本文算法处理后图像在彩色电子纸上显示的图像细节和颜色更加接近原图,整体视觉效果更好。
Abstract
To solve the problems of low color saturation and edge blurring caused by viscous resistance and other factors in color EPD, this paper proposes a color e-paper edge enhancement error diffusion algorithm based on HSL space to improve the display quality. This algorithm first uses an edge detection operator to obtain edge-enhanced images from denoised images. It combines edge-enhanced image pixel neighborhood average gray level, pixel and neighborhood gray level difference, and pixel neighborhood similarity to obtain new RGB image pixel value. Then, the new RGB image is processed by a threshold process to obtain a 16-level RGB image. Finally, the 16-level RGB image is converted to HSL space, and a conversion model between HSL and RGB color spaces is established. According to the brightness and saturation of the pixel, the adjustment factor is calculated to enhance the saturation of the RGB image. Compared with the traditional error diffusion algorithm, the signal-to-noise ratio PSNR of this algorithm is improved by 3.9%~26.7%, the UCIQE is improved by 10.1%~48.2%, and the SSIM is improved by 13.2%~25.4%. The subjective evaluation refers to the ITU-R BT.500-1 standard to design experiments and calculate Z scores. Finally, the image details and colors of the image processed by this paper algorithm are closer to the original image on the color e-paper, and the overall visual effect is better.
-
Key words:
- color electrophoresis display /
- error diffusion /
- saturation /
- edge detection /
- image enhancement
-
Overview
Overview: Electrophoretic display has the similar reflectance and wide viewing angle characteristics as paper, and will not harm the eyes due to the absence of a backlight. At the same time, electrophoretic display has the advantages of low power consumption and bistability, so EPD is often used for e-books, shelf price tags, and billboards. The eye protection characteristics make it deeply loved by the public, so people have more expectations for color EPD. However, there are still problems of unclear details and color distortion in the display image.
There are three main forces involved in electrophoresis particles: the interaction force between particles, the viscous resistance of the solvent, and the electric field force. The time delay of the particles reaching the common electrode is caused by the uneven force between the three factors. The low color saturation of the image and the blurred loss of edge details affect the feelings of the EPD users.
In order to solve the above problems, this paper proposes a color e-paper edge enhancement error diffusion algorithm based on HSL space to improve the display quality. This algorithm first uses an edge detection operator to obtain edge-enhanced images from denoised images. It combines edge-enhanced image pixel neighborhood average gray level, pixel and neighborhood gray level difference, and pixel neighborhood similarity to obtain new RGB image pixel value. Then, the new RGB image is processed by a threshold process to obtain a 16-level RGB image. Finally, the 16-level RGB image is converted to HSL space, and a conversion model between HSL and RGB color spaces is established. According to the brightness and saturation of the pixel, the adjustment factor is calculated to enhance the saturation of the RGB image.
The results show that compared with other algorithms, the proposed algorithm improves the PSNR by 3.9%~26.7%, the saturation by 10.1%~48.2%, and the SSIM by 13.2%~25.4%. The edges and details of the image displayed by EPD are enhanced; the clarity and visibility of the image are improved. Better preserve the information and color of the original image. The EPD shows more parts of the image detail, which are fully enhanced. The colors of the image are closer to the original and more saturated. All these have brought a better visual experience to the users of EPD.
-

-
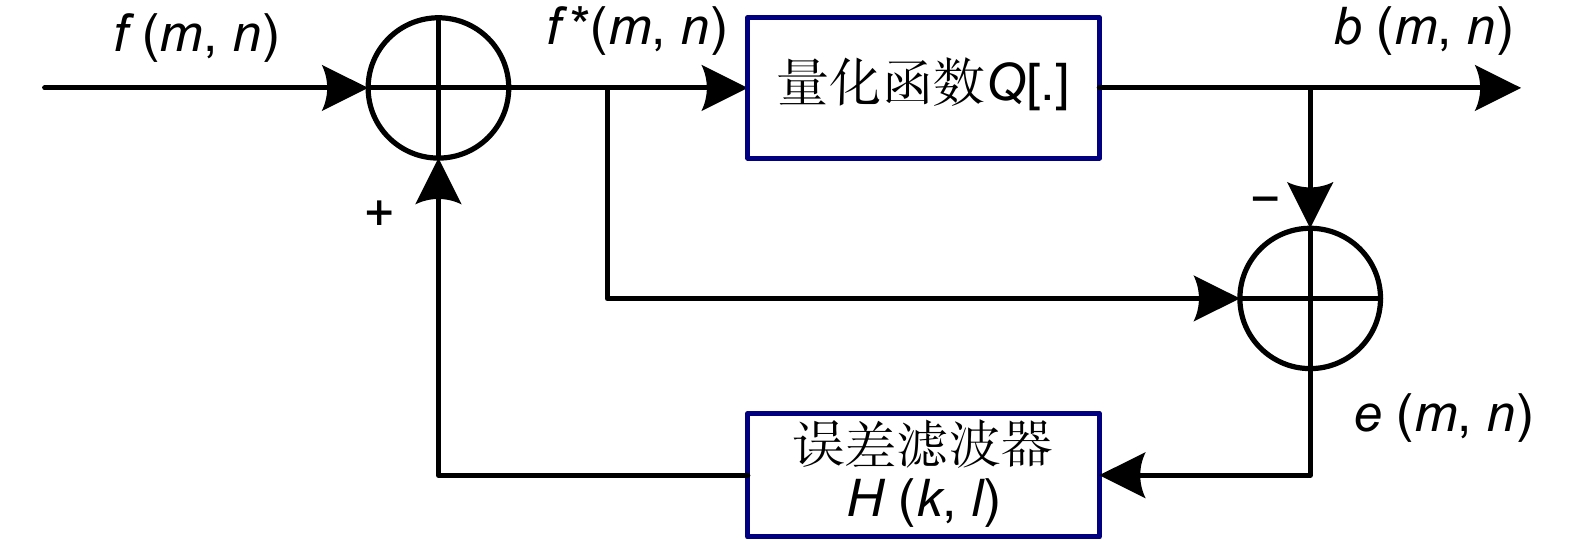
图 1 Floyd-Steinberg误差扩散原理框图
Figure 1. Block diagram of Floyd-Steinberg error diffusion
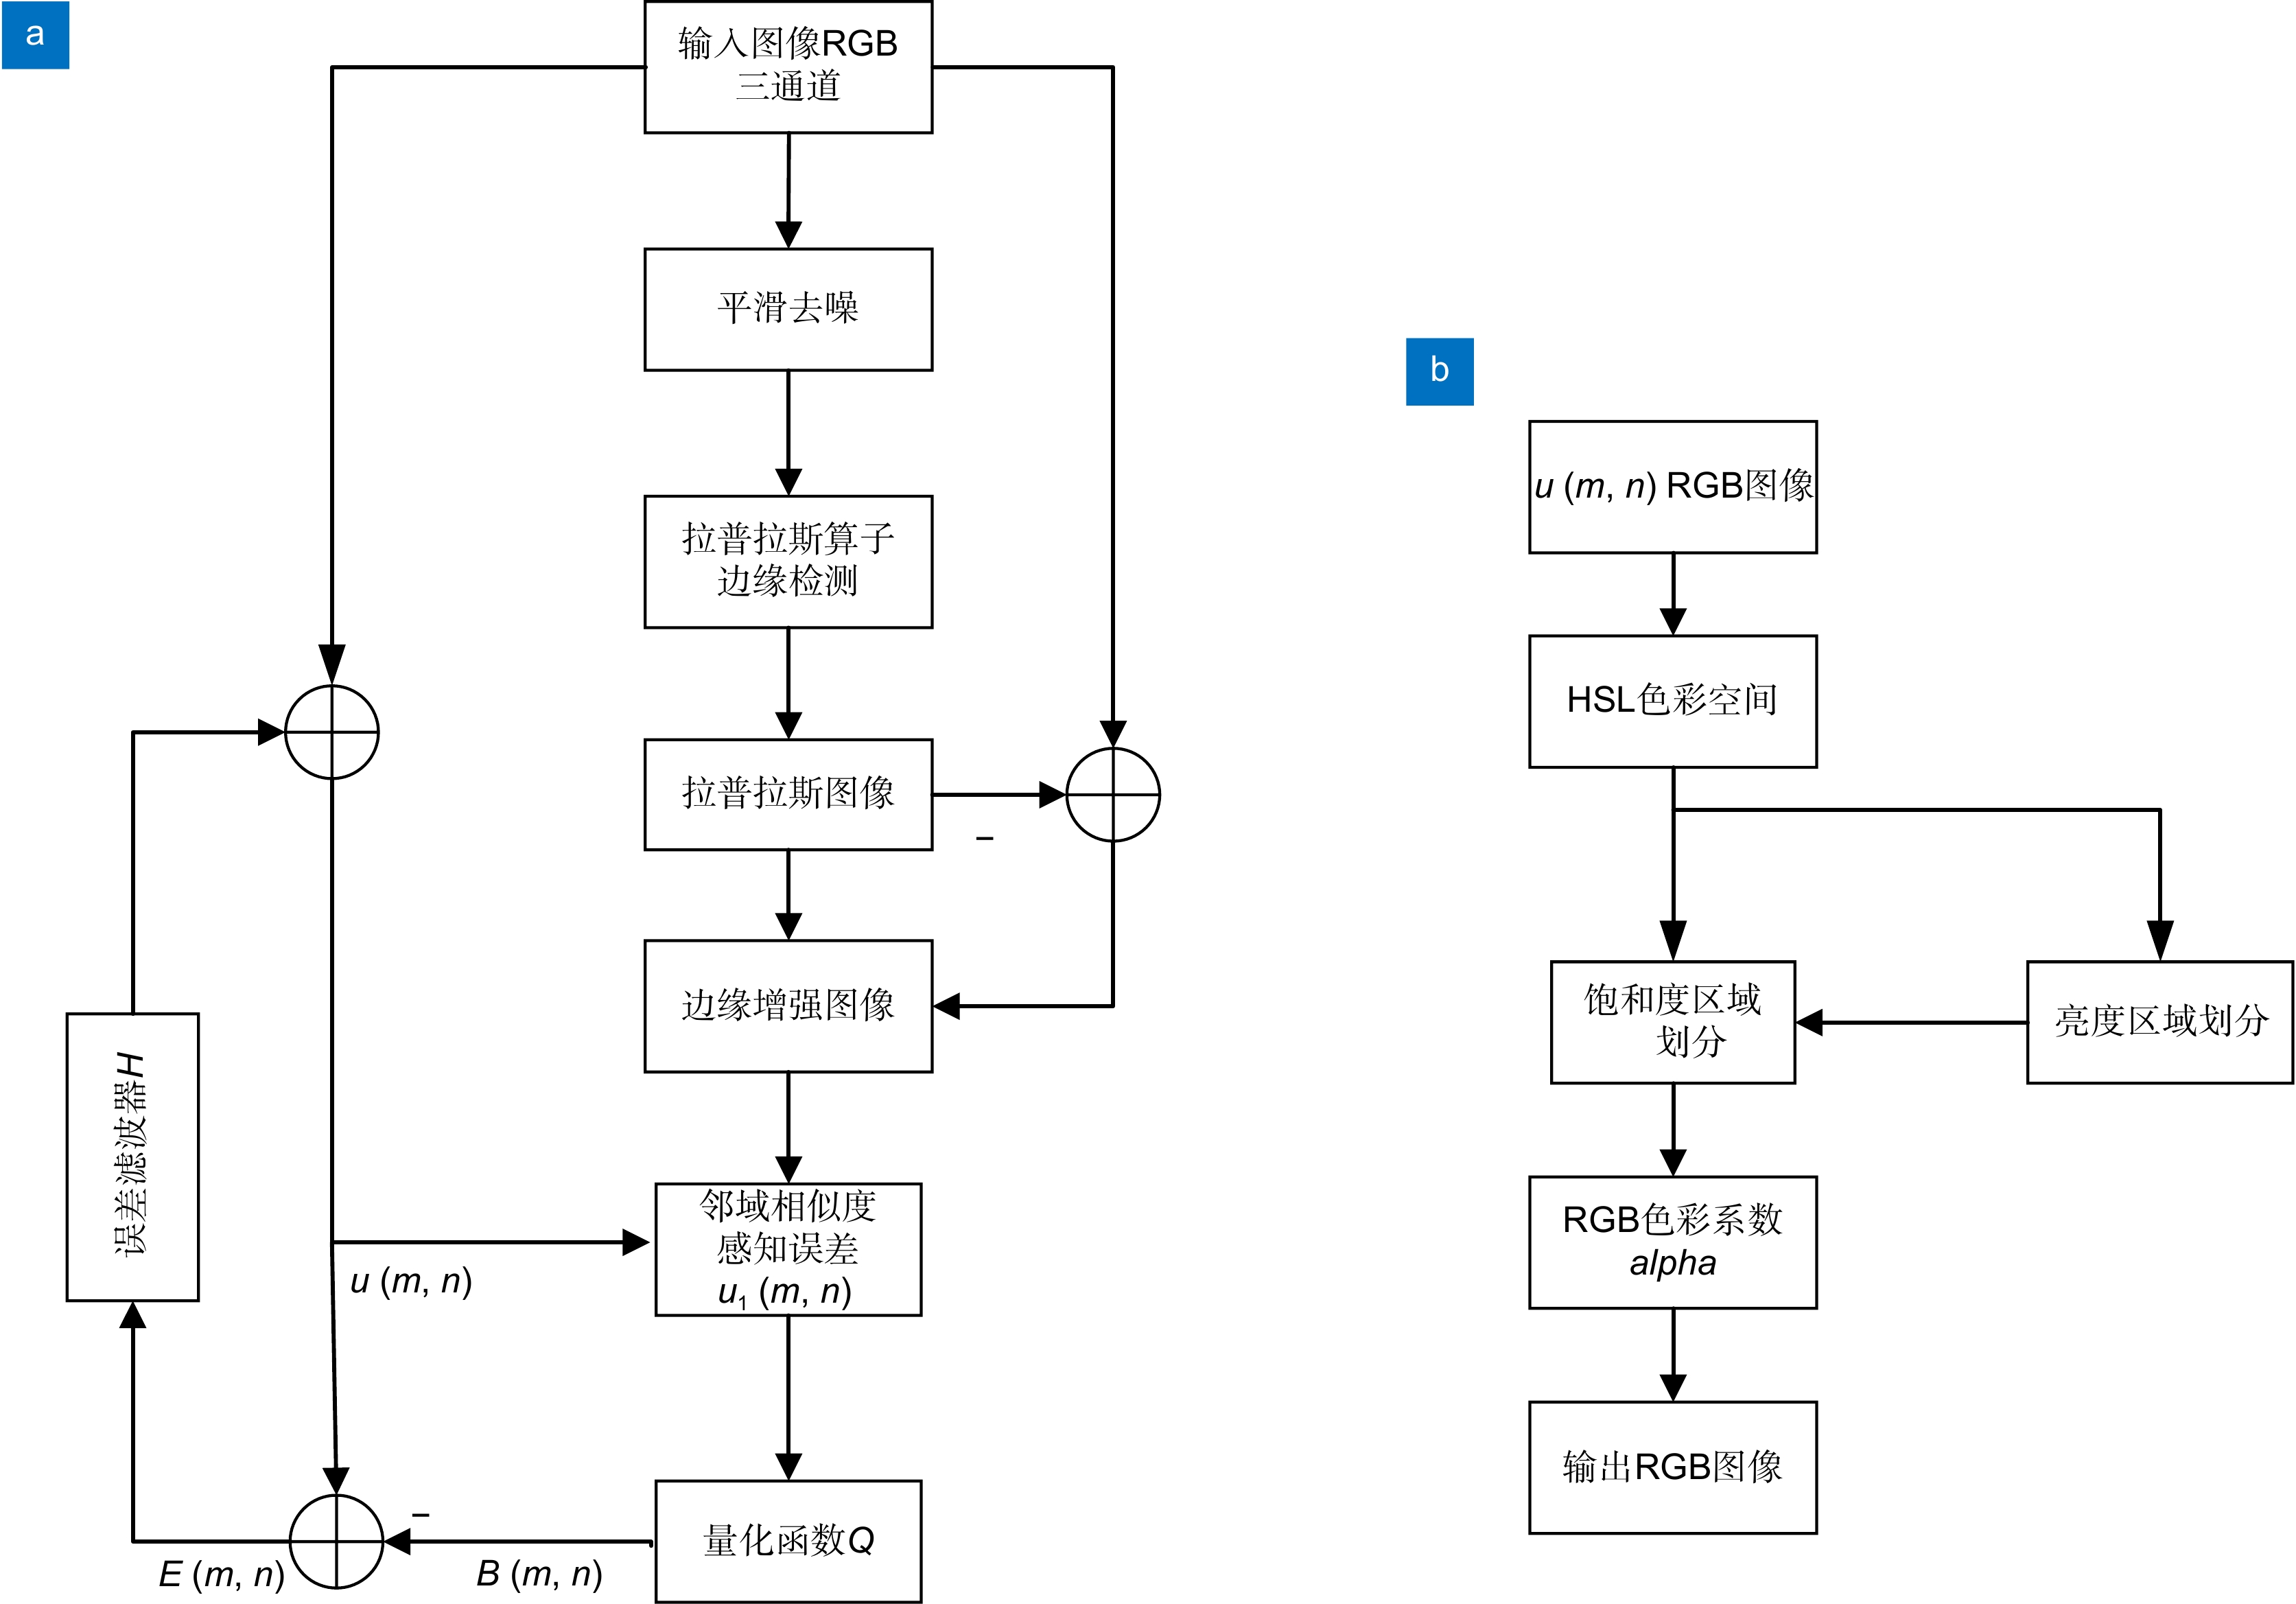
图 2 (a)误差扩散算法流程图; (b)图像饱和度增强流程图
Figure 2. (a) The flow chart of error diffusion algorithm; (b) The flow chart of image saturation enhancement
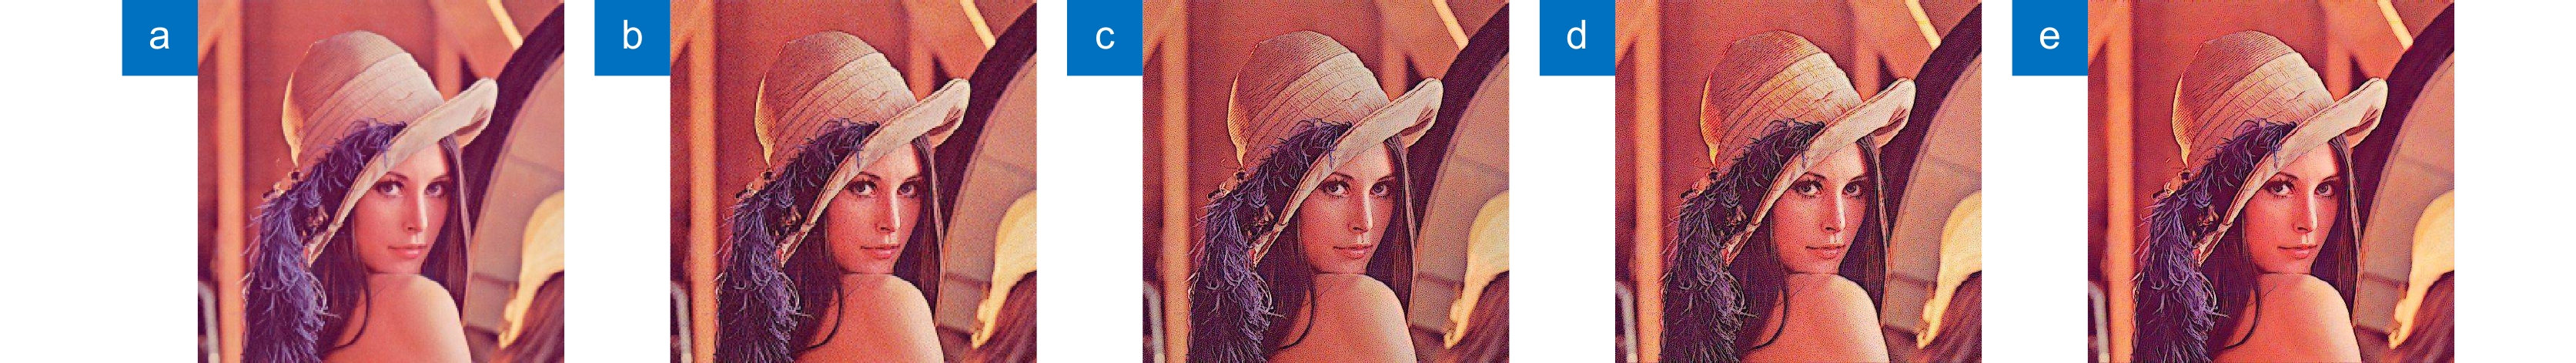
图 3 (a) Lena原图; (b) Floyd-Steinberg算法效果图; (c) Knox算法效果图; (d) Kwak算法效果图; (e) 本文算法效果图
Figure 3. (a) Lena original image; (b) Floyd-Steinberg algorithm rendering; (c) Knox algorithm rendering; (d) Kwak algorithm rendering; (e) Algorithm rendering of this article
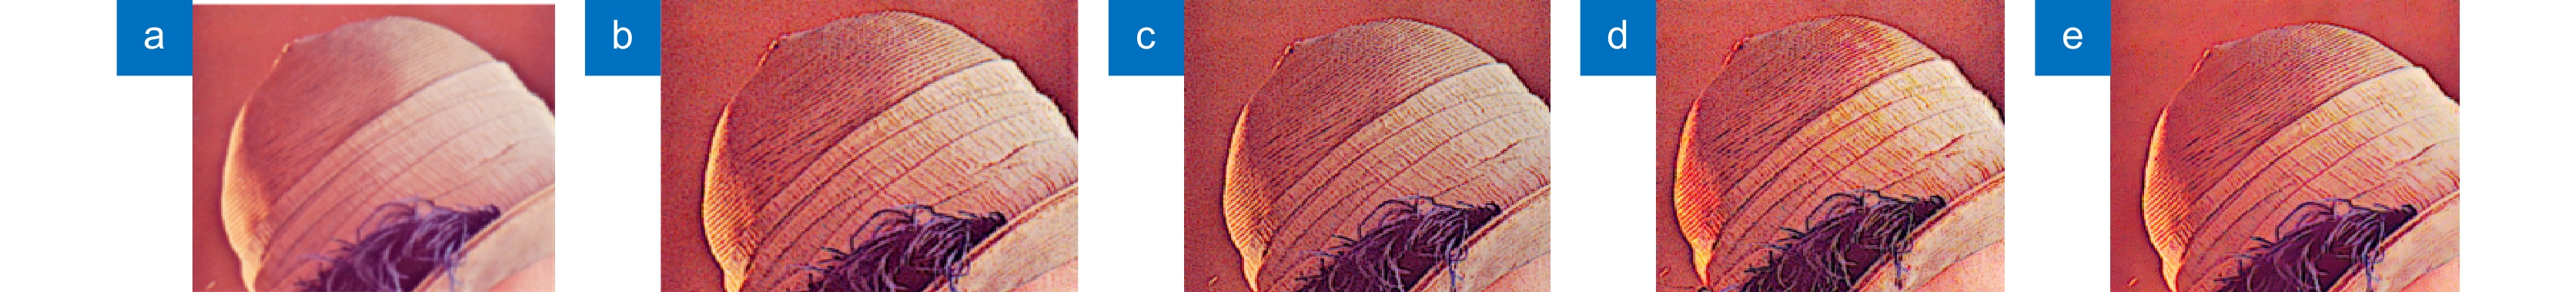
图 4 (a) Lena原图帽子细节图; (b) Floyd-Steinberg算法帽子细节图; (c) Knox算法帽子细节图;(d) Kwak算法帽子细节图; (e) 本文算法帽子细节图
Figure 4. (a) Detailed picture of Lena’s original hat; (b) Detailed picture of Floyd-Steinberg algorithm hat; (c) Detailed picture of Knox algorithm hat; (d) Detailed picture of the Kwak algorithm hat; (e) Detailed picture of the algorithm hat of this article

图 5 (a) Lena原图眼部细节图; (b) Floyd-Steinberg算法眼部细节图; (c) Knox算法眼部细节图;(d) Kwak算法眼部细节图; (e) 本文算法眼部细节图
Figure 5. (a) Detailed picture of Lena’s original eyes; (b) Detailed picture of Floyd-Steinberg algorithm eyes; (c) Detailed picture of Knox algorithm eyes; (d) Detailed picture of the Kwak algorithm eyes; (e) Detailed picture of the algorithm eyes of this article

图 6 (a) Baboon原图; (b) Floyd-Steinberg算法效果图; (c) Knox算法效果图; (d) Kwak算法效果图; (e) 本文算法效果图
Figure 6. (a) Baboon original image; (b) Floyd-Steinberg algorithm rendering; (c) Knox algorithm rendering; (d) Kwak algorithm rendering; (e) Algorithm rendering of this article
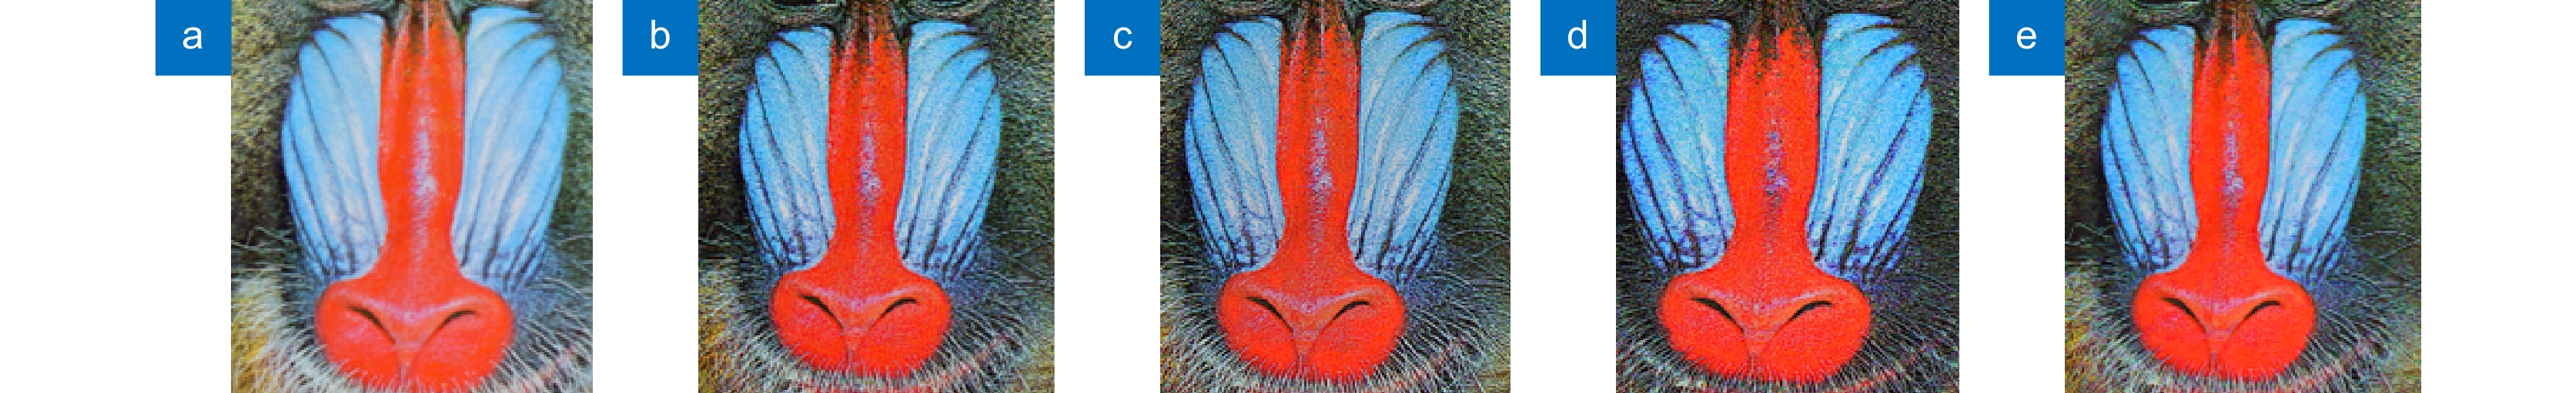
图 7 (a) Baboon原图鼻部细节图; (b) Floyd-Steinberg算法鼻部细节图; (c) Knox算法鼻部细节图;(d) Kwak算法鼻部细节图; (e) 本文算法鼻部细节图
Figure 7. (a) Detailed picture of Lena’s original nose; (b) Detailed picture of Floyd-Steinberg algorithm nose; (c) Detailed picture of Knox algorithm nose; (d) Detailed picture of the Kwak algorithm nose; (e) Detailed picture of the algorithm nose of this article
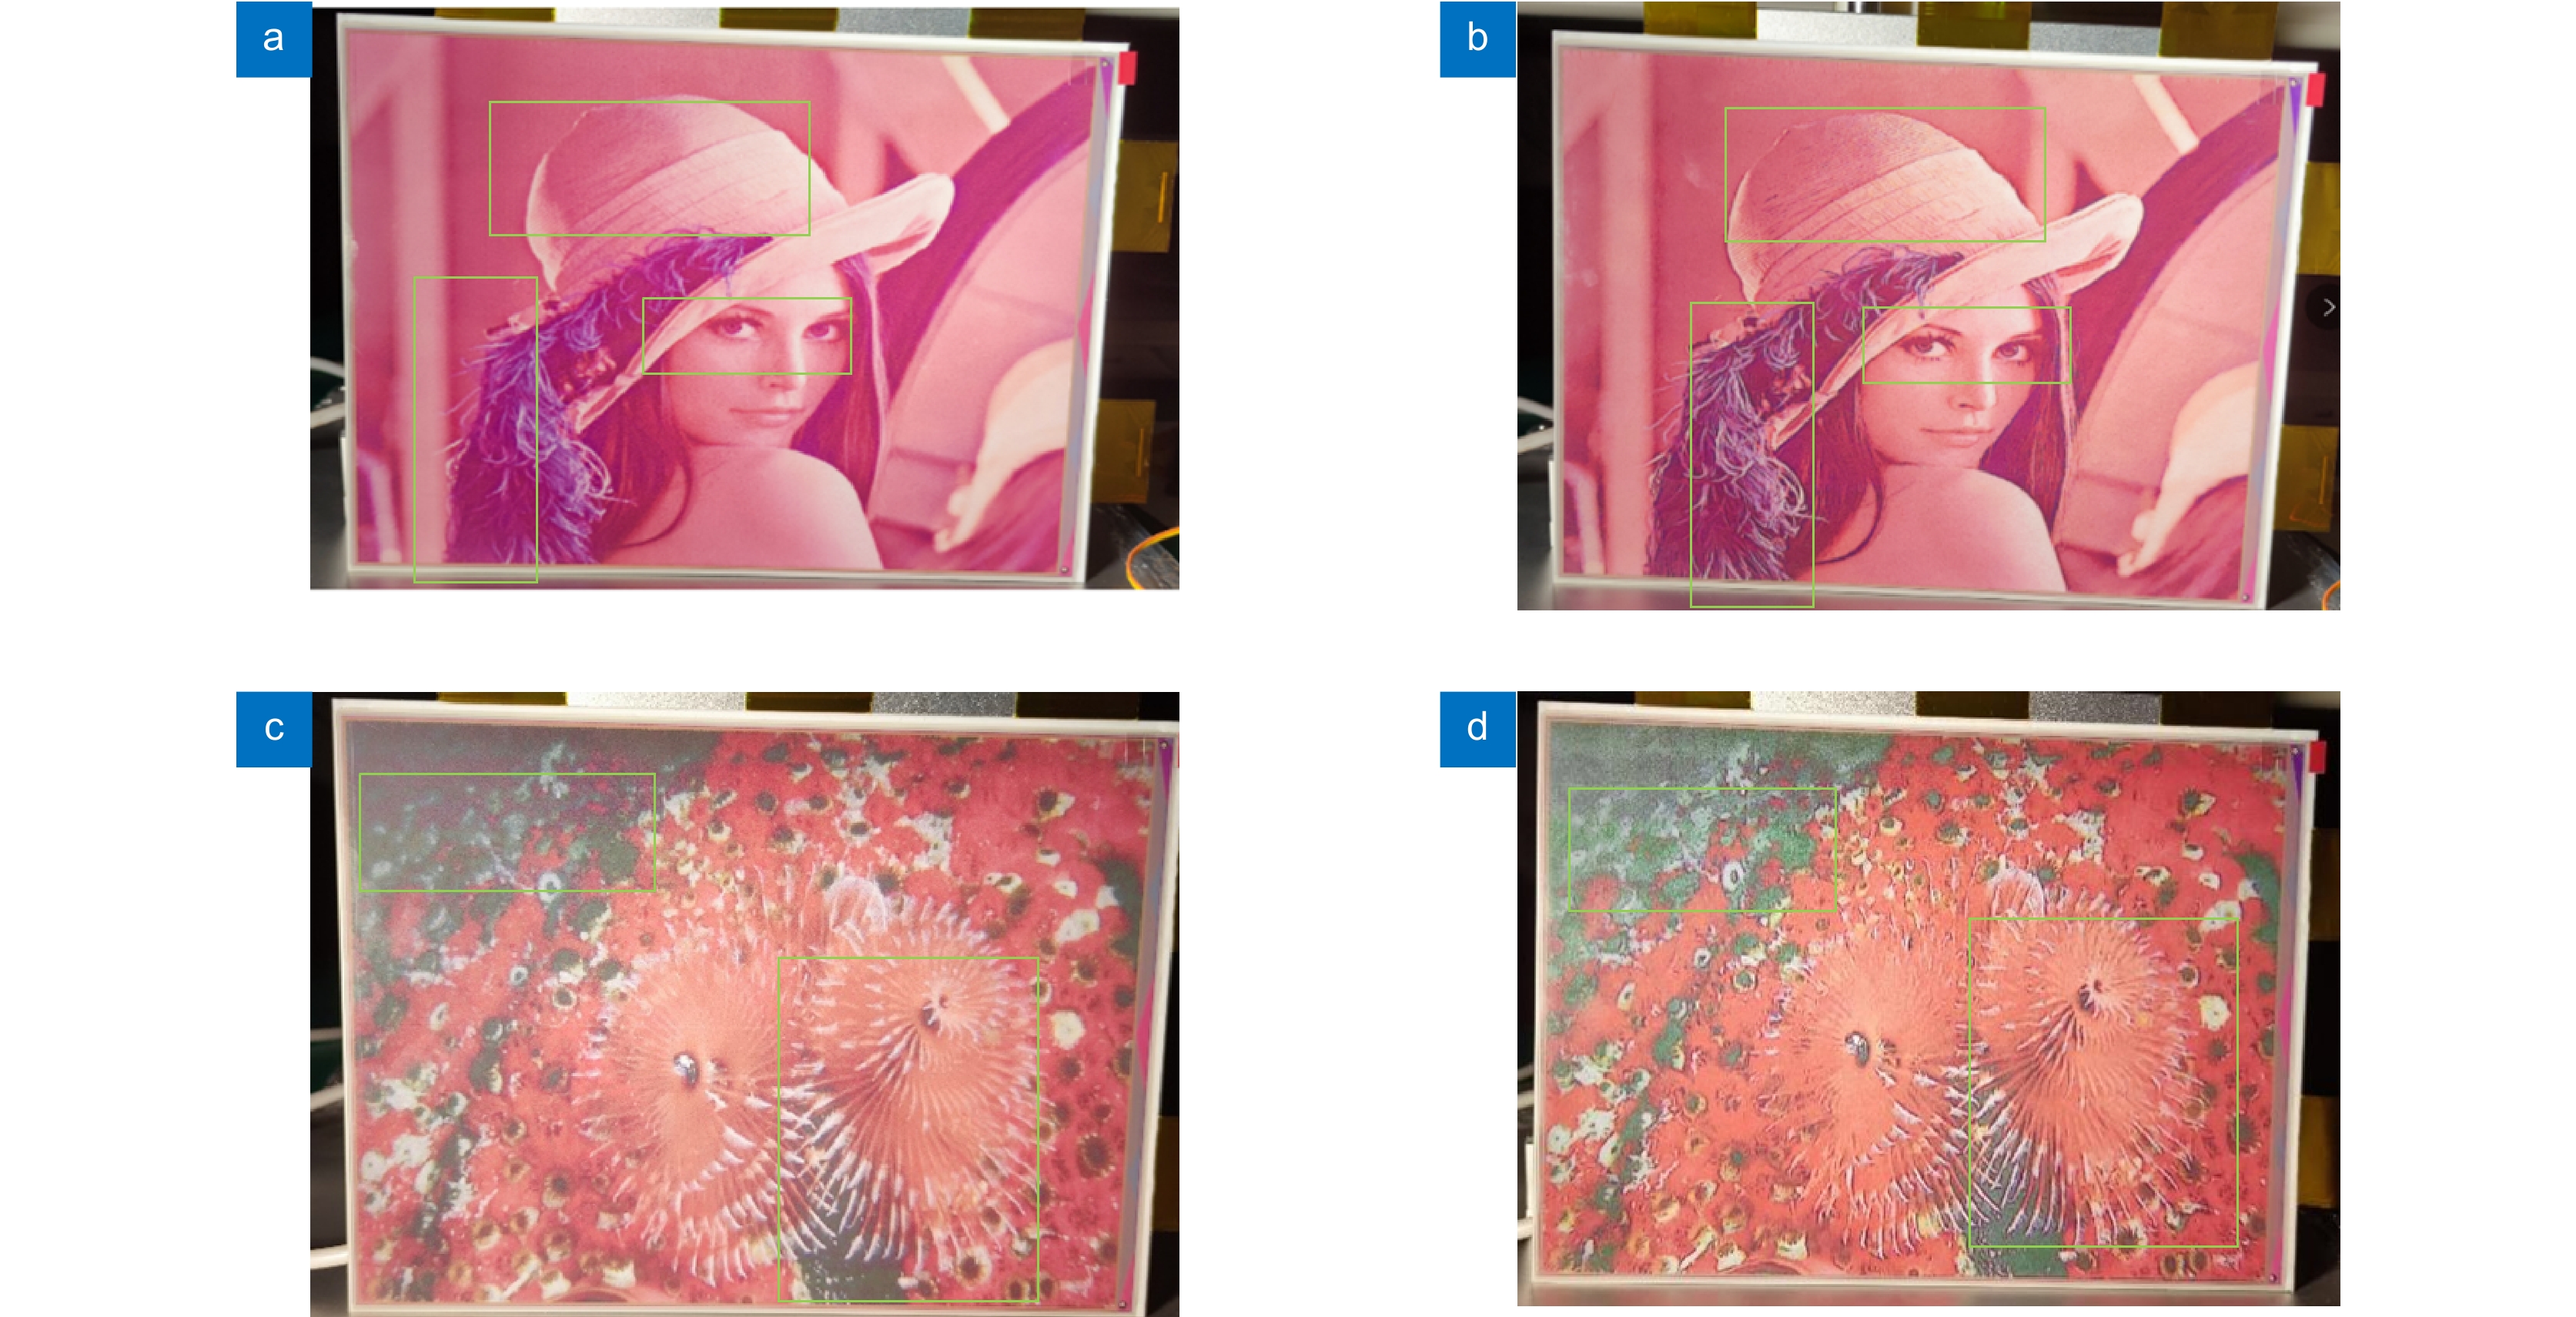
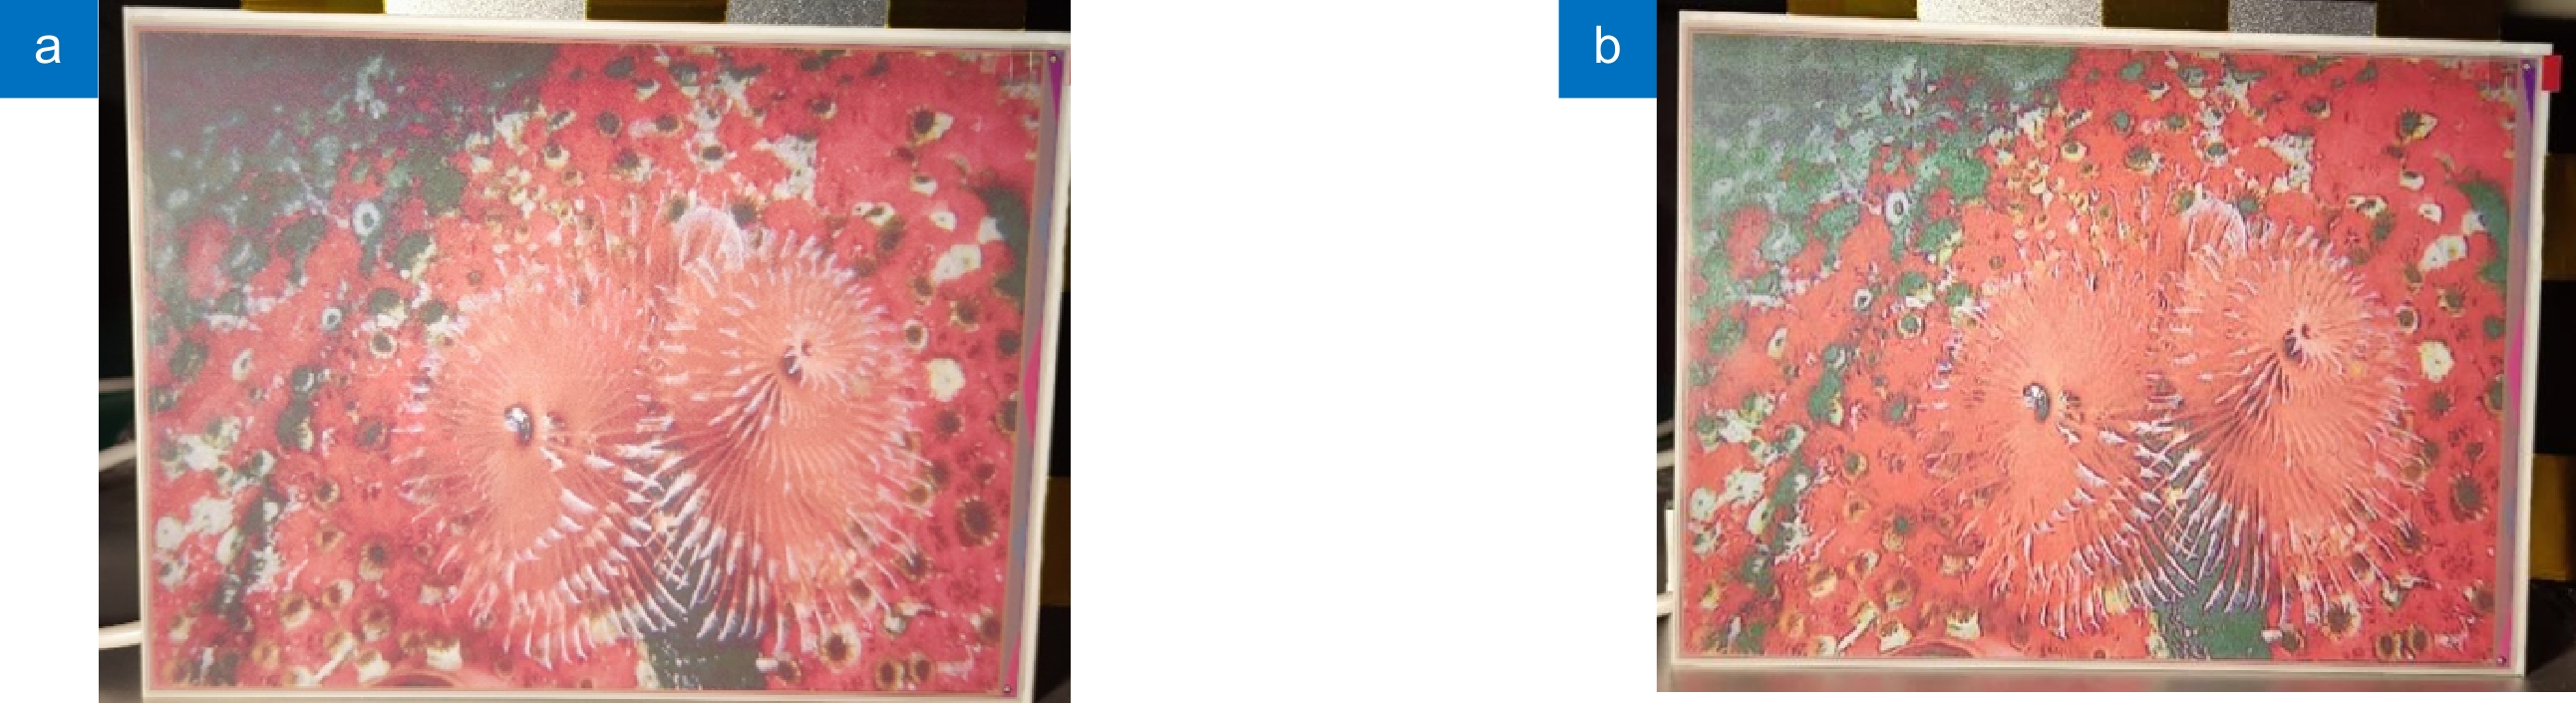
图 8 (a) Lena原图显示效果图;(b) 本文算法处理后Lena显示效果图;(c) 花丛原图显示效果图;(d) 本文算法处理后花丛显示效果图
Figure 8. (a) Rendering of the Lena's original image; (b) Lena display effect after the algorithm processing in this paper; (c) Renderings of the original drawings of the flowers; (d) Effect of the flowers display after the algorithm processing in this paper
表 1 Floyd-Steinberg误差扩散滤波器系数
Table 1. Floyd-Steinberg error diffusion filter coefficient
* 6/17 3/17 5/17 1/17  下载: 导出CSV
表 2 不同边缘误差扩散增强后图像的SSIM、PSNR值和UCIQE值
Table 2. SSIM, PSNR, and UCIQE values of images after different edge error diffusion enhancements
Image datasets Kodak24 CBSD68 PSNR/dB SSIM UCIQE PSNR/dB SSIM UCIQE Floyd-Steinberg 20.1667 0.6111 0.3205 19.8109 0.6468 0.2587 Knox 17.1841 0.6043 0.3265 17.1904 0.6538 0.2901 Kwak 19.7710 0.5996 0.3163 19.2995 0.6508 0.2909 Ours 21.7799 0.7472 0.4001 21.2150 0.7406 0.3835
下载: 导出CSV
表 3 不同显示效果图的Z得分
Table 3. Z-scores for different display renderings
Images Z-sores Before After Figure −0.68 0.68 Animal −0.69 0.69 Scenery −0.68 0.68 House −0.65 0.65 Plant −0.69 0.69 Food −0.68 0.68 Average value −0.678 0.678
下载: 导出CSV
-
参考文献
[1] 杜世远. 基于图像增强技术的电子纸显示驱动系统研制[D]. 福州: 福州大学, 2013.
Du S Y. Driving system of electronic paper display based on image enhancement technology[D]. Fuzhou: Fuzhou University, 2013.
[2] Huitema E, French I. E ink's technicolor moment: the road to color E-Paper took two decades[J]. IEEE Spectr, 2022, 59(2): 30−35. doi: 10.1109/MSPEC.2022.9706404
[3] Kao W C, Hong K D, Hsu C Y. Color reproduction of multi-pigment color electronic papers[C]//Proceedings of 2023 IEEE International Conference on Consumer Electronics, 2023: 1–2. https://doi.org/10.1109/ICCE56470.2023.10043485.
[4] Kao W C, Ye J A, Chu M I, et al. Image quality improvement for electrophoretic displays by combining contrast enhancement and halftoning techniques[J]. IEEE Trans Consumer Electron, 2009, 55(1): 15−19. doi: 10.1109/TCE.2009.4814408
[5] Floyd R W, Steinberg L. An adaptive algorithm for spatial gray scale[C]//Proceeding of the Society for Information Displays, 1975: 75–77.
[6] 林夏薇, 林东. 多级半色调技术在电纸书显示优化中的应用[J]. 计算机系统应用, 2015, 24(3): 31−37. doi: 10.3969/j.issn.1003-3254.2015.03.005
Lin X W, Lin D. Multitoning technology application in the electric paper books display optimization[J]. Comput Syst Appl, 2015, 24(3): 31−37. doi: 10.3969/j.issn.1003-3254.2015.03.005
[7] 赵静, 唐晓静. 基于HVS模型及边缘检测的像素点误差扩散半色调算法[J]. 宁夏大学学报(自然科学版), 2008, 29(1): 37−39. doi: 10.3969/j.issn.0253-2328.2008.01.007
Zhao J, Tang X J. A pixel error diffusion halftoning based on HVS model and edge detection[J]. J Ningxia Univ (Nat Sci Ed), 2008, 29(1): 37−39. doi: 10.3969/j.issn.0253-2328.2008.01.007
[8] 曾素云, 林珊玲, 林志贤, 等. 基于邻域灰度信息误差扩散算法的电润湿电子纸研究[J]. 液晶与显示, 2019, 34(3): 317−323. doi: 10.3788/YJYXS20193403.0317
Zeng S Y, Lin S L, Lin Z X, et al. Error diffusion algorithm based on neighborhood gray information in electrowetting electronic paper research[J]. Chin J Liq Cryst Disp, 2019, 34(3): 317−323. doi: 10.3788/YJYXS20193403.0317
[9] Wu K M, Inoue K, Hara K. Neugebauer models for color error diffusion halftoning[J]. J Imaging, 2020, 6(4): 23. doi: 10.3390/jimaging6040023
[10] Gong Y H, Tang W M, Zhou L B, et al. Quarter Laplacian filter for edge aware image processing[C]//Proceedings of 2021 IEEE International Conference on Image Processing, 2021: 1959–1963. https://doi.org/10.1109/ICIP42928.2021.9506503.
[11] 孙慧贤, 张玉华, 罗飞路. 基于HSI颜色空间的彩色边缘检测方法研究[J]. 光学技术, 2009, 35(2): 221−224,228. doi: 10.3321/j.issn:1002-1582.2009.02.005
Sun H X, Zhang Y H, Luo F L. Color edge detection based on HSI color space[J]. Opt Tech, 2009, 35(2): 221−224,228. doi: 10.3321/j.issn:1002-1582.2009.02.005
[12] 林胜华, 汪继文, 沈玉峰, 等. 利用邻域相似度的图像修复[J]. 计算机工程与应用, 2010, 46(7): 190−191,220. doi: 10.3778/j.issn.1002-8331.2010.07.058
Lin S H, Wang J W, Shen Y F, et al. Image inpainting by neighborhood similarity[J]. Comput Eng Appl, 2010, 46(7): 190−191,220. doi: 10.3778/j.issn.1002-8331.2010.07.058
[13] Knox K T, Eschbach R. Threshold modulation in error diffusion[J]. J Electron Imaging, 1993, 2(3): 185−192. doi: 10.1117/12.148736
[14] Kwak N J, Ryu S P, Ahn J H. Edge-enhanced error diffusion halftoning using human visual properties[C]//Proceedings of 2006 International Conference on Hybrid Information Technology, 2006: 499–504. https://doi.org/10.1109/ICHIT.2006.253533.
[15] Zeng Z, Liu G Y, Yang M Y, et al. Simulation and analysis of edge ghosting for microcapsule E-Paper based on particles dynamics[J]. SID Symp Dig Tech Papers, 2022, 53(S1): 29−32. doi: 10.1002/sdtp.15828
[16] Franzen R. Kodak lossless true color image suite[EB/OL]. 1999. https://r0k.us/graphics/kodak/.
[17] Martin D, Fowlkes C, Tal D, et al. A database of human segmented natural images and its application to evaluating segmentation algorithms and measuring ecological statistics[C]//Proceedings Eighth IEEE International Conference on Computer Vision, 2001. https://doi.org/10.1109/ICCV.2001.937655.
[18] Yang M, Sowmya A. An underwater color image quality evaluation metric[J]. IEEE Trans Image Process, 2015, 24(12): 6062−6071. doi: 10.1109/TIP.2015.2491020
[19] ITU-R. Methodologies for the subjective assessment of the quality of television pictures: Recommendation ITU-R BT. 500-14[S]. Geneva: ITU-R, 2019.
[20] Mantiuk R K, Tomaszewska A, Mantiuk R. Comparison of four subjective methods for image quality assessment[J]. Comput Graphics Forum, 2012, 31(8): 2478−2491. doi: 10.1111/j.1467-8659.2012.03188.x
-
访问统计
 点击扫一扫
点击扫一扫
图(9)
表(3)
计量
- 文章访问数:
- PDF下载数:
- 施引文献: 0


