
 E-mail Alert
 RSS
RSS
-
摘要
针对现有的红外光强与偏振图像融合中融合有效度度量稳定性低且不符合人类视觉系统的问题,通过比较常见的基于距离度量的三种融合有效度函数化度量方法,分析比较了多种融合算法对差异特征融合有效度分布的稳定性;通过统计十组源图像的差异特征幅值区间中出现最优融合算法的频次,从而得出每种差异特征的最优融合算法,进而得到了余弦相似性为一种稳定性高且与人类主观观察结果更符合的融合有效度的度量方式。实验结果表明,在多种融合算法的融合有效度度量的融合效果中,余弦相似性具有高稳定性且与人类视觉分析有良好的匹配性。

Abstract
To solve the problem of low stability of fusion validity measurement in existing fusion of infrared intensity and polarization images, the stability of various fusion algorithms for the distribution of fusion validity of different features was analyzed and compared by using three common fusion validity function measurement methods based on measurement distance. By calculating the frequency of the optimal fusion algorithm in difference feature amplitude interval of ten groups of images, the optimal fusion algorithms for each difference feature were obtained, and cosine similarity was obtained as a measure of fusion efficiency with high stability and more consistent with subjective observation results of the humans. The experimental results show that the cosine similarity has high stability and good matching with human vision analysis in the fusion effectiveness measurement of various fusion algorithms.
-
Key words:
- image fusion /
- dual-mode infrared images /
- fusion validity /
- cosine similarity
-
Overview

Overview: In the existing fusion of infrared intensity and polarization images, the optimal fusion efficiency measurement method is not sought, and leads to the inability to accurately reflect the real fusion situation in different imaging scenes. Therefore, to solve the above problems, this paper firstly constructs the class sets of difference features and the class sets of fusion algorithms aiming at the image features and fusion features of the dual-mode images. Then, the difference features were defined and the meaning of fusion validity was defined. The fusion validity evaluation functions were constructed by using the distance measurement formulas. Among them, the three common functional representations of distance measurement were Euclidean distance, cosine similarity and Lance and Williams distance. Based on the difference features amplitudes of the maximum and the minimum in the source image, all the difference features amplitudes will be interval equal (here are divided into 20 groups), and the interval of each amplitude will be measured, and gets each amplitude range in the difference features of the approximate fusion validity, and finally gets the source images in 20 amplitude ranges of approximate fusion validity distribution curves, it is concluded that the different variety of fusion algorithms for different features of fusion validity distribution curves. According to the thought that difference features drive selecting the optimal fusion algorithm, the dual-mode images for difference features classes focus on different features of amplitude, through the use of three kinds of measurement for fusion validity based on the concentration of 12 kinds of fusion algorithm, and get fusion validity of discrete points distribution, then the amplitude of difference features intervals was classified. The amplitudes of difference features intervals discrete points are averaged which contributes the curves distribution of fusion validity under different fusion algorithms for each differential feature amplitude. Again in each amplitude range, the algorithm with the maximum fusion validity value is selected. The optimal fusion algorithm in each difference feature amplitude interval and the overall fusion efficiency of the interval represented by the optimal fusion algorithm are also obtained. The frequency of the optimal fusion algorithm in the difference feature amplitude interval of the ten groups of source images was counted, thus the optimal fusion algorithm of each difference feature is obtained. The experimental results show that the cosine similarity has high stability and good matching with human vision analysis in the fusion measurement validity of various fusion algorithms.
-

-
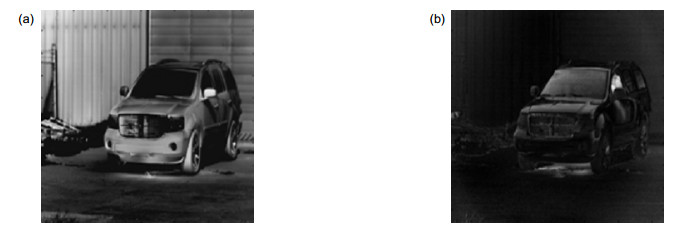
图 1 源红外光强与红外偏振图像。(a)红外光强图像;(b)红外偏振图像
Figure 1. Source infrared intensity and infrared polarization images. (a) Infrared intensity image; (b) Infrared polarization image
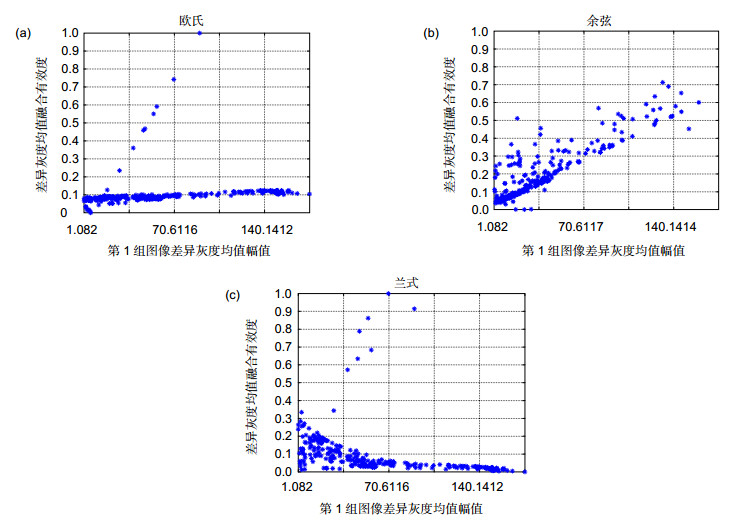
图 2 融合有效度散点分布图。(a)基于欧氏距离;(b)基于余弦相似性;(c)基于兰式距离
Figure 2. Scatter distribution of fusion validity. (a) Based on Euclidean distance; (b) Based on cosine similarity; (c) Baesd on Lance and Williams distance

图 3 融合有效度曲线图。(a)基于欧氏距离;(b)基于余弦相似性;(c)基于兰式距离
Figure 3. Curve of fusion validity. (a) Based on Euclidean distance; (b) Based on cosine similarity; (c) Baesd on Lance and Williams distance
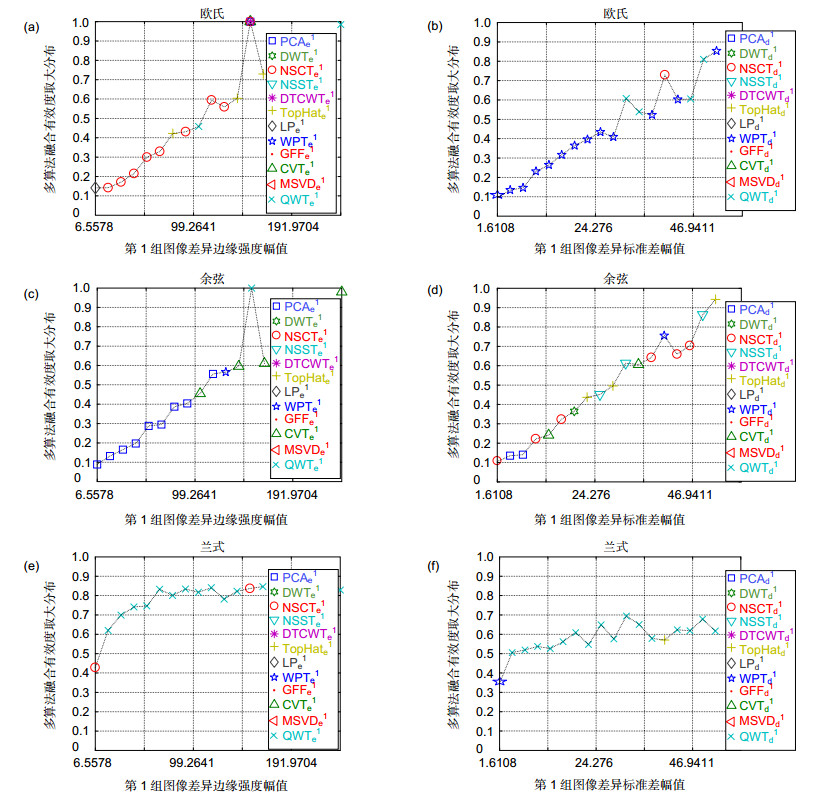
图 4 多算法下融合有效度在幅值区间的取大分布。(a),(b)基于欧氏距离;(c),(d)基于余弦相似性;(e),(f)基于兰式距离
Figure 4. The distribution of the maximum value of the fusion validity in the amplitude interval under multiple algorithms. (a), (b) Based on Euclidean distance; (c), (d) Based on cosine similarity; (e), (f) Baesd on Lance and Williams distance
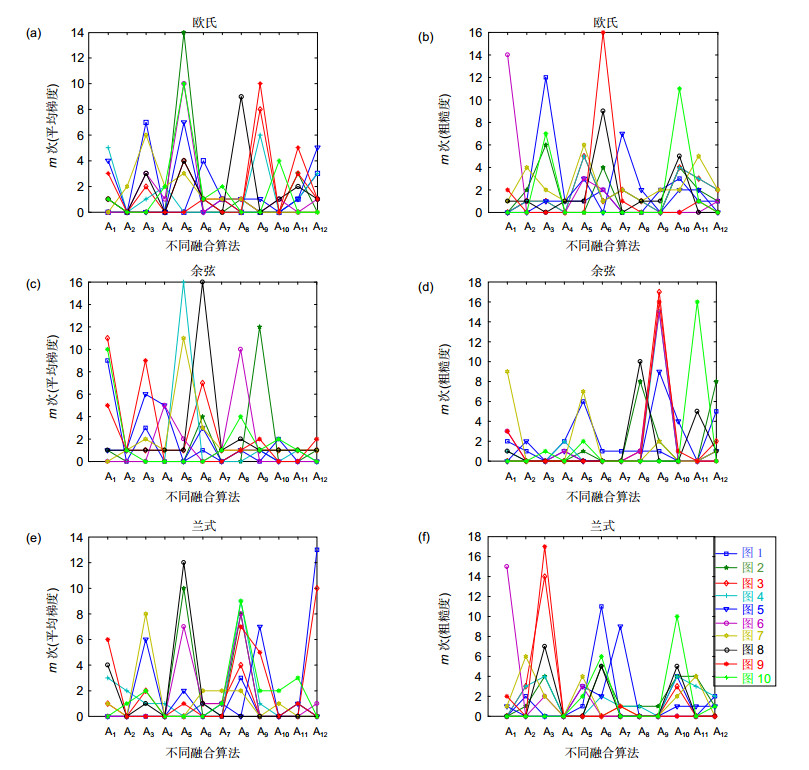
图 5 不同差异特征在幅值区间中最优融合算法出现的频数。(a),(b)欧氏距离;(c),(d)余弦相似性;(e),(f)兰式距离
Figure 5. The frequency of occurrence of the optimal fusion algorithm in the amplitude interval of different difference features.(a), (b) Based on Euclidean distance; (c), (d) Based on cosine similarity; (e), (f) Baesd on Lance and Williams distance
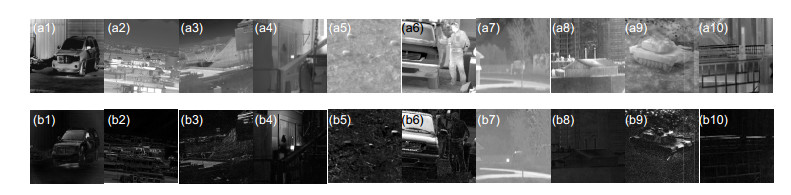
图 6 源双模态红外图像。(a)红外光强图像;(b)红外偏振图像
Figure 6. Source dual-mode infrared images. (a) Infrared intensity image; (b) Infrared polarization image
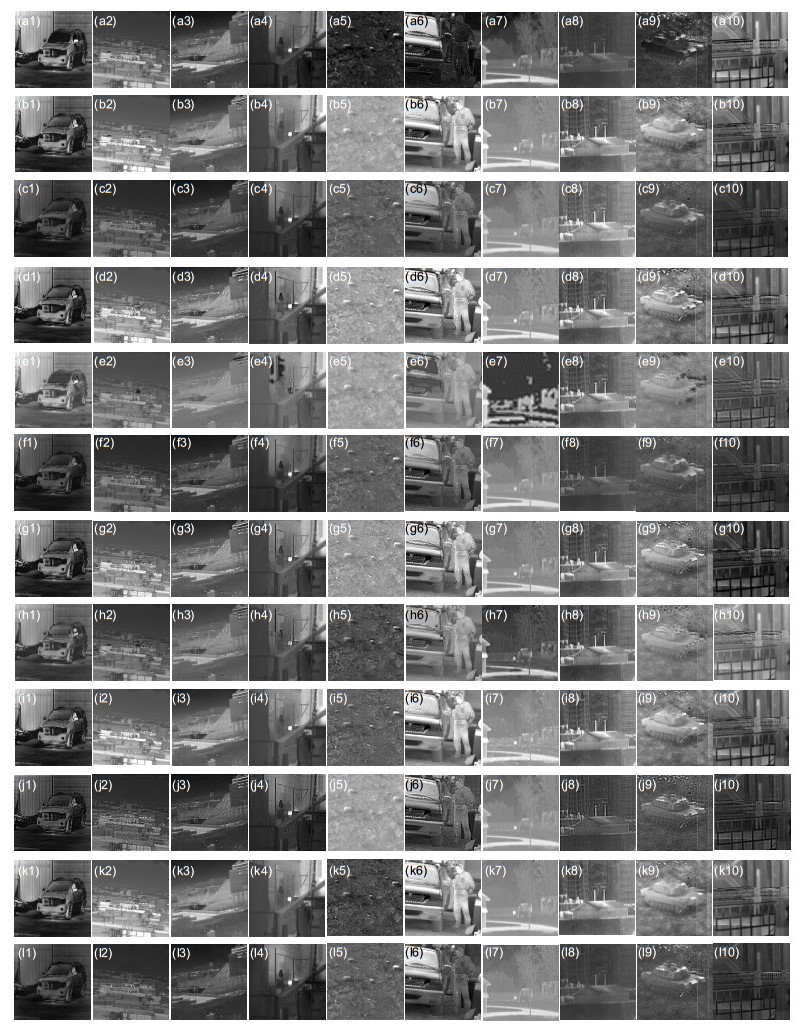
图 7 融合结果图。(a) PCA; (b) DWT; (c) NSCT; (d) NSST; (e) DTCWT; (f) TH; (g) LP; (h) WPT; (i) GFF; (j) CVT; (k) MSVD; (l) QWT
Figure 7. Fusion result diagram. (a) PCA; (b) DWT; (c) NSCT; (d) NSST; (e) DTCWT; (f) TH; (g) LP; (h) WPT; (i) GFF; (j) CVT; (k) MSVD; (l) QWT
表 1 差异灰度均值融合有效度度量方式的稳定度评价
Table 1. The stability evaluation of the measurement method of fusion validity of difference gray mean
Characterization methods(M) 1 2 3 4 5 6 7 8 9 10 ED(σ) 0.2749 0.2434 0.2969 0.2470 0.2586 0.2203 0.2720 0.2733 0.2418 0.2776 CS(σ) 0.0211 0.0236 0.0338 0.0311 0.0732 0.1115 0.0498 0.0043 0.1070 0.0220 LAWD(σ) 0.3140 0.3218 0.3323 0.3180 0.2713 0.2757 0.2822 0.3352 0.2952 0.3371  下载: 导出CSV
表 2 差异边缘强度融合有效度度量方式的稳定度评价
Table 2. The stability evaluation of the measurement method of fusion validity of difference edge intensity
Characterization methods(EI) 1 2 3 4 5 6 7 8 9 10 ED(σ) 0.1734 0.1647 0.1812 0.1464 0.1593 0.1397 0.1475 0.1518 0.1552 0.1337 CS(σ) 0.0205 0.0219 0.0659 0.0439 0.0421 0.0308 0.0406 0.0133 0.0444 0.0246 LAWD(σ) 0.2741 0.2416 0.2599 0.1786 0.2146 0.1810 0.1791 0.2183 0.1917 0.1129
下载: 导出CSV
表 3 差异标准差融合有效度度量方式的稳定度评价
Table 3. The stability evaluation of the measurement method of fusion validity of difference standard deviation
Characterization methods(SD) 1 2 3 4 5 6 7 8 9 10 ED(σ) 0.1526 0.1875 0.1316 0.1479 0.0754 0.1546 0.1525 0.1866 0.1024 0.1332 CS(σ) 0.0343 0.0194 0.0547 0.0737 0.0459 0.0873 0.0372 0.0180 0.0672 0.0534 LAWD(σ) 0.1877 0.1817 0.1767 0.1365 0.1932 0.1821 0.1621 0.2520 0.1570 0.1405
下载: 导出CSV
表 4 差异平均梯度融合有效度度量方式的稳定度评价
Table 4. The stability evaluation of the measurement method of fusion validity of difference average gradient
Characterization methods(AG) 1 2 3 4 5 6 7 8 9 10 ED(σ) 0.1725 0.1477 0.1785 0.1584 0.1416 0.1552 0.1488 0.1952 0.1996 0.1642 CS(σ) 0.0137 0.0222 0.0550 0.0395 0.0488 0.0311 0.0291 0.0258 0.0225 0.0237 LAWD(σ) 0.2684 0.2450 0.2597 0.2023 0.2013 0.2013 0.1527 0.2984 0.2062 0.2433
下载: 导出CSV
表 5 差异粗糙度融合有效度度量方式的稳定度评价
Table 5. The stability evaluation of the measurement method of fusion validity of difference coarseness
Characterization methods(CA) 1 2 3 4 5 6 7 8 9 10 ED(σ) 0.0911 0.0695 0.1154 0.0876 0.1249 0.0951 0.0679 0.1154 0.1176 0.0697 CS(σ) 0.0478 0.0461 0.1041 0.0651 0.0678 0.0839 0.0625 0.0674 0.1205 0.0330 LAWD(σ) 0.0774 0.0826 0.1443 0.0981 0.1286 0.1047 0.0753 0.1342 0.1710 0.0728
下载: 导出CSV
表 6 差异对比度融合有效度度量方式的稳定度评价
Table 6. The stability evaluation of the measurement method of fusion validity of difference contrast
Characterization methods(CN) 1 2 3 4 5 6 7 8 9 10 ED(σ) 0.1343 0.2063 0.1600 0.1438 0.0661 0.1476 0.1529 0.1783 0.0955 0.1709 CS(σ) 0.0322 0.0185 0.0578 0.0739 0.0514 0.0985 0.0385 0.0185 0.0733 0.0294 LAWD(σ) 0.1837 0.1884 0.1817 0.1271 0.1968 0.1785 0.1541 0.2684 0.1590 0.1478
下载: 导出CSV
表 7 差异特征在幅值区间中累计出现频次最高的最优融合算法
Table 7. The optimal fusion algorithm with the highest cumulative frequency appears in the amplitude interval
Characterization methods M EI SD AG CA CN ED(m) PCA(53) WPT(32) DTCWT(31) DTCWT(52) TH(21) WPT(35) CS(m) DTCWT(86) PCA(43) NSST(40) PCA(38) GFF(77) NSST(39) LAWD(m) NSCT(57) DTCWT(52) DTCWT(35) WPT(50) NSCT(50) DTCWT(44)
下载: 导出CSV
-
参考文献
[1] 杨风暴, 李伟伟, 蔺素珍, 等.红外偏振与红外光强图像的融合研究[J].红外技术, 2011, 33(5): 262–266. doi: 10.3969/j.issn.1001-8891.2011.05.004
Yang F B, Li W W, Lin S Z, et al. Study on fusion of infrared polarization and intensity images[J]. Infrared Technology, 2011, 33(5): 262–266. doi: 10.3969/j.issn.1001-8891.2011.05.004
[2] 杨艳春, 李娇, 王阳萍.图像融合质量评价方法研究综述[J].计算机科学与探索, 2018, 12(7): 1021–1035. doi: 10.3778/j.issn.1673-9418.1710001
Yang Y C, Li J, Wang Y P. Review of image fusion quality evaluation methods[J]. Journal of Frontiers of Computer Science & Technology, 2018, 12(7): 1021–1035. doi: 10.3778/j.issn.1673-9418.1710001
[3] 郭喆.双模态红外图像融合有效度分布的合成研究[D].太原: 中北大学, 2018: 19–20.
Guo Z. Study on synthesis of fusion validity distribution of bimodal infrared images[D]. Taiyuan: North University of China, 2018: 19–20.
[4] 牛涛, 杨风暴, 王志社, 等.一种双模态红外图像的集值映射融合方法[J].光电工程, 2015, 42(4): 75–80. doi: 10.3969/j.issn.1003-501X.2015.04.013
Niu T, Yang F B, Wang Z S, et al. A set-valued mapping fusion method of dual-mode infrared image[J]. Opto-Electronic Engineering, 2015, 42(4): 75–80. doi: 10.3969/j.issn.1003-501X.2015.04.013
[5] 张雷.面向拟态变换的异类红外图像融合算法协同嵌接方法研究[D].太原: 中北大学, 2018: 38–42.
Zhang L. Research on collaborative and embedded method of heterogeneous infrared image fusion algorithm for mimic transformation[D]. Taiyuan: North University of China, 2018: 38–42.
[6] 安富, 杨风暴, 牛涛.模糊逻辑与特征差异驱动的红外偏振图像融合模型[J].红外技术, 2014, 36(4): 304–310. doi: 10.11846/j.issn.1001_8891.201404010
An F, Yang F B, Niu T. A fusion model of infrared polarization images based on fuzzy logic and feature difference driving[J]. Infrared Technology, 2014, 36(4): 304–310. doi: 10.11846/j.issn.1001_8891.201404010
[7] 孙君顶.图像特征提取与检索技术[M].北京:电子工业出版社, 2015: 15–16.
Sun J D. Image Feature Extraction and Retrieval Technology[M]. Beijing: Electronic Industry Press, 2015: 15–16.
[8] 陈文安.子空间方法及其核扩展的研究[D].北京: 北方工业大学, 2006: 23–26.
Chen W A. Subspace methods and their kernelization[D]. Beijing: North China University of Technology, 2006: 23–26.
[9] Tamura H, Mori S, Yamawaki T. Textural features corresponding to visual perception[J]. IEEE Transactions on Systems, Man, and Cybernetics, 1978, 8(6): 460–473. doi: 10.1109/TSMC.1978.4309999
[10] Bach F R, Jordan M I. Kernel independent component analysis[J]. Journal of Machine Learning Research, 2002, 3(1): 1–48. doi: 10.1162/153244303768966085
[11] Melzer T. Generalized canonical correlation analysis for object recognition[D]. Vienna: Vienna University of Technology, 2002.
[12] 刘帅奇, 郑伟, 赵杰, 等.数字图像融合算法分析与应用[M].北京:机械工业出版社, 2018: 3–6.
Liu S Q, Zheng W, Zhao J, et al. Analysis and Application of Algorithm for Digital Image Fusion[M]. Beijing: Mechanical Industry Press, 2018: 3–6.
[13] Yi Q J, Wang H T, Guo R P, et al. Laser ultrasonic quantitative recognition based on wavelet packet fusion algorithm and SVM[J]. Optik, 2017, 149: 206–219. doi: 10.1016/j.ijleo.2017.08.105
[14] Li S T, Kang X D, Hu J W. Image fusion with guided filtering[J]. IEEE Transactions on Image Processing, 2013, 22(7): 2864–2875. doi: 10.1109/TIP.2013.2244222
[15] Malini S, Moni R S. Image denoising using multiresolution singular value decomposition transform[J]. Procedia Computer Science, 2015, 46: 1708–1715. doi: 10.1016/j.procs.2015.02.114
[16] Fletcher P, Sangwine S J. The development of the quaternion wavelet transform[J]. Signal Processing, 2017, 136: 2–15. doi: 10.1016/j.sigpro.2016.12.025
[17] Ye J. Cosine similarity measures for intuitionistic fuzzy sets and their applications[J]. Mathematical and Computer Modelling, 2011, 53(1–2): 91–97. doi: 10.1016/j.mcm.2010.07.022
[18] 段汕, 王小凡, 张洪.图像相似性度量方法的研究[J].中南民族大学学报(自然科学版), 2016, 35(4): 121–125. doi: 10.3969/j.issn.1672-4321.2016.04.026
Duan S, Wang X F, Zhang H. Research on method of similarity measure for images[J]. Journal of South-Central University for Nationalities (Natural Science Edition), 2016, 35(4): 121–125. doi: 10.3969/j.issn.1672-4321.2016.04.026
-
访问统计
 点击扫一扫
点击扫一扫
图(7)
表(7)
计量
- 文章访问数:
- PDF下载数:
- 施引文献: 0


