
 E-mail Alert
 RSS
RSS
-
摘要:
无论是通讯光纤还是医用光纤,光纤的几何参数总是评价其质量的重要指标。灰度法是国标GB15972.20-2008中的建议方法,但该方法在拟合过程中会出现拟合圆与椭圆的中心不重合,存在测量原理上的缺陷。且当光纤的切割效果与照明条件发生改变时,往往导致测量数据的不稳定并带来误差。本文用更符合光纤端面实际的任意椭圆函数(非标准椭圆),且仅用这一种函数拟合的方法求取光纤几何参数,从而从根本上消除由圆拟合与椭圆拟合的中心不一致带来的原理缺陷。同时,由于在计算各个参数时不需要图像分布灰度的具体值,从而降低了对测量条件的要求。实验表明,本文方法能有效提高仪器测量结果的稳定性和一致性。
Abstract:The fiber geometry of communication fibers and medical fibers are always standards to evaluate the quality of optical fibers. The measurement of fiber geometry with gray scale method is one of the commonly used measurement methods. It is also the proposed method in the national standard GB15972.20-2008. In this method, the fiber geometry is obtained by fitting the elliptical curve and fitting the circular curve in two steps, but the center of the two curves may not be coincided. Thus, there is a defect in the measurement principle in the method. The measurement of fiber geometry with gray scale method has a high requirement for cutting effects and lighting conditions. When measurement conditions change, it often leads to the instability of the measured data and brings errors. In this paper, we use the arbitrary elliptical function (non-standard ellipse) which is more suitable for the fiber end face, and only use this function fitting method to get the fiber geometry to fundamentally eliminate the principle defect caused by the inconsistent center fitting between the circle fitting and the ellipse fitting. At the same time, the requirement of measurement condition is reduced, because the specific value of image distribution grayscale is not needed when calculating each parameter. Experiments show that this method can effectively improve the stability and consistency of measurement results.
-
Key words:
- optical fiber geometry /
- gray scale method /
- ellipse curve fitting
-

Overview: The fiber geometry of communication fibers and medical fibers are always important parameters to evaluate the quality of optical fibers. The fiber geometry mainly includes the diameter and ovality of claddings and cores, and the concentricity error of claddings and cores. The measurement of fiber geometry with gray scale method is one of the commonly used measurement methods proposed in the national standard GB15972.20-2008. In the gray scale method, the fiber geometry is obtained by two-step fittings that are the fitting of circular curve and the fitting of ellipse curve. However, the geometric centers of the two fitting curves may not necessarily coincide, causing the measurement inaccuracy of fiber geometry. Obviously, there is a defect of the measurement principle in the method. The measurement of fiber geometry with gray scale method has a high requirement for cutting effects and lighting conditions. When measurement conditions change, it often leads to the instability of the measured data and brings errors. This paper proposes a method for obtaining the optical fiber geometry with fitting the edge of optical fiber in an arbitrary ellipse curve (non-standard ellipse) which more coincide the real optical fiber end face.
The method is mainly divided into three steps: image preprocessing, edge extraction and ellipse curves fitting. The first step, image preprocessing, is to eliminate some of the noise errors in the image by median filtering the image, in order to make the subsequent edge extraction better. The second step, edge extraction, is to use the Canny operator to extract the image of the optical fiber end face. At this time, there are still some noise signals and false edges at the edge of the optical fiber. The third step, ellipse curves fitting, is to fit the edge data points with the arbitrary ellipse, and to set an appropriate threshold value at the edge of the fitting ellipse curve, then is to remove the data points beyond the threshold value as error data points. All optical fiber geometry can be calculated by arbitrary ellipse curve in one-step fitting, so eliminating the measurement error caused by the center inconsistency between the circle curve fitting and the ellipse curve fitting. At the same time, because the specific value of the image distribution gray scale is not required when calculating each parameter, the edge data of the optical fiber is used for fitting, thereby the measurement condition is effectively reduced. Taking fiber core data as an example, the data of diameter and ovality measured by the standard instrument are 8.420 μm and 0.670%, respectively. When cutting effect of fiber end face or lighting condition is poor, the instrument data become 9.436 μm and 2.016%, while the data measured in this paper are 8.804 μm and 0.553%, respectively. Experiment results show that the method can significantly improve the accuracy and precision of the measurement results of instruments.
-
1. 引言
近年来,光纤在许多行业都有了很广泛的应用,包括通讯行业和医疗器械行业。光纤的几何参数是影响光纤质量的重要指标,这就对光纤几何参数的精准测量提出了更高的要求。根据我国国家标准的规定,对光纤几何参数的测量主要包括包层、纤芯的直径和不圆度以及包层与纤芯的同心度误差[1]。
对于光纤几何参数的测量,传统的方法有折射近场法[3-4],横向干涉法[5-6],近场光分布法[7],机械直径法等。近场光分布法有很多优点,如测量速度快,可测量的参数多,无需人工读数,因此是目前最常用的方法。近场光分布法还分为近场扫描法[8-10]和灰度法[11]两种主要测量方法,其中灰度法被许多仪器采用。国标中对灰度法的定义是通过光学显微镜对光纤的端面进行放大,利用CCD相机获取光纤的端面图像。在对光纤边缘进行椭圆函数拟合后,再进行第二步即再作一次圆函数拟合,从而求出光纤的各个几何参数[1],此方法因为原理简单直观在目前光纤几何参数测量中得到广泛应用。陈磊等人根据国标中的测量原理,用椭圆函数的拟合获得光纤的不圆度,圆函数的拟合计算光纤的等效半径,光纤端面的灰度重心作为光纤的几何中心来求得各个几何参数[2]。这种按照国标测量原理的方法,本质上是对光纤边缘进行了圆函数和椭圆函数两种曲线的拟合,但是由于这两种拟合过程独立进行,往往导致两种拟合结果不能完全匹配(比如圆中心与椭圆中心不相同),另外有时光纤端面的切割效果不佳或照明光灰度分布不均匀,这些都会直接影响测量结果的稳定性和准确性,这是测量原理上存在的一种缺陷。
事实上光纤端面一般情况下是椭圆(圆端面仅是椭圆端面的一种理想状态,当椭圆的长短径相等时椭圆退化为圆),因此本文提出仅利用任意椭圆函数这一种函数(非直角坐标系下的标准椭圆,用数学上椭圆函数的一般方程式表示)来拟合测量光纤几何参数的方法。利用椭圆函数拟合(省掉了圆函数拟合这一步),即可同时求出光纤的包层、纤芯的直径和不圆度以及包层与纤芯的同心度误差等参数,避免了测量原理上的缺陷。同时,由于在计算各个参数时不需要图像灰度分布的具体值,从而降低了对测量条件的要求,有效提高在光纤切割不佳或照明不均匀情况下的测量稳定性或一致性,提高了重复测量精度。
2. 测量原理及几何参数
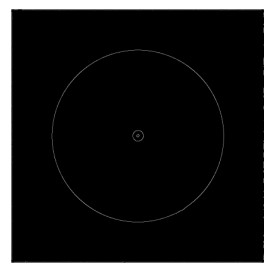
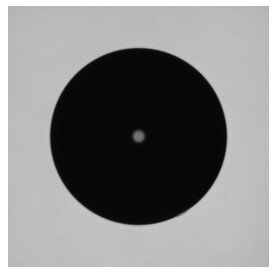
本文基于灰度法来测量光纤的几何参数。利用光学显微镜对光纤(型号为G652,工业中的一种常用光纤)的端面进行放大,通过CCD相机采集到光纤端面的灰度图像,如图 1所示。图中外围亮场为照明区域,对纤芯通光以区分包层与纤芯的边界,包层由于不通光而显示为黑色区域。
2.1 图像滤波去噪
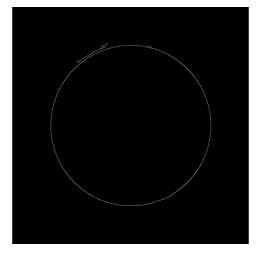
CCD采集到的图像通常带有很强的噪声,直接对其进行边缘提取会夹杂很多噪声,如图 2所示,故有必要对采集到的图像先进行预处理。
由于后续需要对光纤图像提取边缘,所以在滤波去噪时应尽可能地保留边缘信息,本文采用中值滤波与均值滤波法对光纤图像进行滤波去噪处理。
2.2 图像边缘提取
Canny算子是一种常用的边缘提取算子,可以有效提取滤波后的光纤端面的边缘[12-14]。经过滤波提取的边缘图像可能还存在一些噪声点,通过一些形态学操作以及限制半径区域即可将绝大部分噪声点去除。经滤波及用Canny算子提取的光纤端面边缘图像如图 3所示。
2.3 光纤边缘点的任意椭圆拟合
获得光纤的边缘图像后,提取出光纤的边缘坐标进行椭圆拟合[15-17]。由于包层与纤芯的处理方法基本相同,所以后续处理仅以包层为例。本文采用最小二乘法实现对光纤边缘点的椭圆拟合。在平面直角坐标系中,任意一个椭圆函数可以用椭圆方程的隐式方程或一般方程表示[18-19],如式(1):
Ax2+Bxy+Cy2+Dx+Ey+F=0。 (1) 若用向量形式,则可写成式(2)的形式:
f(α,X)=α⋅X=Ax2+Bxy+Cy2+Dx+Ey+F=0, (2) 其中α=(A,B,C,D,E,F)为椭圆一般方程的系数向量,X=(x2i,xiyi,y2i,xi,yi,1)为坐标点数据。
确定椭圆函数的过程,实际上就是求系数向量的过程。根据最小二乘法原理,即可求出使目标函数f为最小值的系数向量,如式(3)所示:
f(A,B,C,D,E,F)=n∑i=1(Ax2i+Bxiyi+Cy2i+Dxi+Eyi+F)2。 (3) 若要使目标函数取得最小值,则需满足:
∂f∂A=∂f∂B=∂f∂C=∂f∂D=∂f∂E=∂f∂F=0。 (4) 在迭代计算中增加约束条件防止出现零解,即可确定系数向量的值。进一步通过式(5)~式(9)可计算出拟合椭圆的中心坐标和长短径。
xc=BE−2CD4AC−B2, (5) yc=BD−2AE4AC−B2, (6) a=2×√−2FA+C−√B2+(A−CF)2, (7) b=2×√−2FA+C+√B2+(A−CF)2, (8) θ=12arctan(FA−C), (9) 式中:xc,yc为椭圆的中心坐标,a, b分别为椭圆的长、短径,θ为椭圆长径的旋转角度。
当被测光纤的切割端面不佳或光照灰度不均匀时,图像中可能会出现边缘模糊或阴影噪声,如图 4所示。
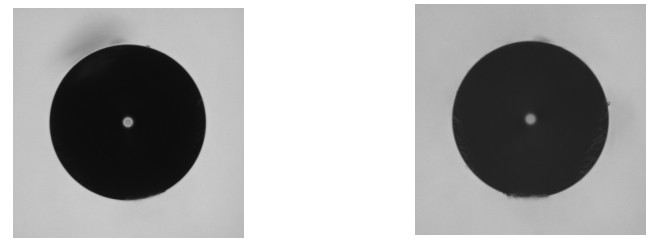 图 4. 非正常条件下的光纤端面图。(a)非正常端面1;(b)非正常端面2Figure 4. Fiber end face image under improper conditions. (a) End face1; (b) End face2
以图 4(a)为例,虽然通过滤波处理可以去除一部分的噪声,但提取出的光纤边缘仍然可能出现误差数据点或虚假边缘。图 5为有干扰误差的包层边缘图像。
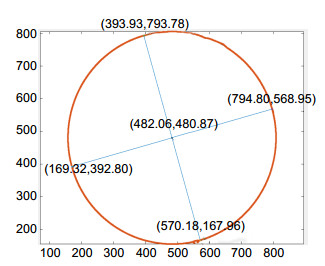
对拟合椭圆设定一个合适的阈值,将超出椭圆边界的数据点剔除,可以消除或平滑光纤边缘的误差点,提高拟合结果的精度。图 6为对光纤包层边缘采用椭圆拟合后的结果。
2.4 光纤几何参数的计算
如上所述,当椭圆函数拟合完成后,可得到式(2)中的系数向量α,进而通过式(5)~式(9)得到拟合椭圆的长径,短径,中心坐标及旋转角度。分别对光纤包层及纤芯作椭圆函数拟合,即可由式(10)、式(11)求出包层或纤芯的中心坐标:
xclad(xcore)=xc, (10) yclad(ycore)=yc, (11) 式中:xclad,yclad为包层的中心坐标,xcore,ycore为纤芯的中心坐标。
当得到包层和纤芯的中心坐标后,即可计算光纤的同心度误差,计算公式为
l=√(xcore−xclad)2+(ycore−yclad)2。 (12) 光纤不圆度的计算公式为
δ=(Rmax−Rmin (13) 式中:{R_{{\rm{max}}}}为光纤的长径,{R_{\min }}为光纤的短径,R为光纤的等效半径。
根据式(7)、式(8)可得:
{R_{{\rm{max}}}} = a, (14) {R_{{\rm{min}}}} = b。 (15) 在计算等效半径时,取椭圆长短径的几何平均值,即式(16):
R = \sqrt {a \cdot b}。 (16) 3. 光纤几何参数测量与讨论
对于光纤几何参数的测量,在国标GB15972.20-2008中建议的灰度法需要二步函数拟合,即椭圆函数拟合和圆函数拟合,这可能会出现圆和椭圆中心不重合的情况,从而出现测量误差,影响测量精度。陈磊等人提出的利用光纤端面图像灰度重心作为光纤的中心[2],这种方法的弊端在于当光纤端面的照明不均匀或切割效果不佳时,灰度分布的重心会发生偏移,此时的灰度重心实际上已不能代表光纤的几何中心,从而产生测量误差。
本文提出的用任意椭圆函数拟合的测量方法,能避免上述测量原理上的缺陷或不足。
3.1 光纤端面正常条件下的几何参数测量
本文比对参考使用的测量仪为原机械工业部上海电缆研究所研制的FGM-5光纤几何参数测量仪。该仪器是目前市面上常见的光纤几何参数测量仪,在国内众多光纤生产大厂都有应用。该仪器的测量原理及方法采用国标GB15972.20-2008提出的测量原理,且与陈磊等人的论文所述方法基本相同,利用圆和椭圆的两次拟合结果来给出包层、纤芯的直径和不圆度及包层与纤芯之间的同心度误差等参数。该仪器的主要测量指标为:测试时间 < 50 s,重复测量精度≤0.05 μm,不圆度重复测量精度≤0.10%,芯-包同心度的重复测量精度≤0.04 μm,完全满足国标对光纤几何尺寸测量的要求。
测试光纤的型号为G652。在光纤端面正常切割条件下,用FGM-5测量仪测得的光纤几何参数如表 1所示,5组数据为对光纤端面的5次采样测得的几何参数。表中的平均值为5组实验数据的平均值,最大偏差为各组实测数据与平均值之差的最大值(取绝对值)。
表 1. FGM-5几何参数测试仪的正常测量数据Table 1. Standard data of FGM-5 optical fiber geometry measurement system实验组数 包层直径/μm 包层不圆度/% 纤芯直径/μm 纤芯不圆度/% 芯-包同心度/μm 1 125.073 0.116 8.421 0.865 0.241 2 125.094 0.117 8.409 0.335 0.236 3 125.120 0.118 8.431 0.666 0.246 4 125.101 0.098 8.449 0.616 0.247 5 125.093 0.102 8.388 0.868 0.221 平均值 125.096 0.110 8.420 0.670 0.238 最大偏差 0.024 0.012 0.032 0.335 0.017 | Show Table DownLoad:
CSV
DownLoad:
CSV
根据国标GB15972.20-2008GB/T 9771.1-2008中的要求,单模光纤的包层直径应为(125±1) μm,包层不圆度应≤1.0%,芯—包同心度应≤0.6μm,可见该测试光纤满足使用要求(国标中对纤芯的几何参数没有强制要求)[1]。
表 2为采用本文方法得到的测量数据(本文采用的硬件系统与FGM-5测试仪完全一致)。
表 2. 实测的几何参数数据Table 2. Measured fiber geometry data实验组数 包层直径/μm 包层不圆度/% 纤芯直径/μm 纤芯不圆度/% 芯-包同心度/μm 1 125.081 0.108 8.589 0.465 0.210 2 125.101 0.114 8.551 0.208 0.191 3 125.125 0.111 8.575 0.751 0.198 4 125.108 0.122 8.583 0.862 0.188 5 125.097 0.114 8.532 0.446 0.201 平均值 125.102 0.114 8.566 0.546 0.198 最大偏差 0.023 0.008 0.034 0.338 0.012 | Show TableDownLoad:
CSV
由表 1与表 2可以看出,在光纤正常切割条件下,本文方法的测量结果与标准仪器测量的结果基本一致,包层与纤芯直径的重复测量误差为0.03 μm,包层不圆度的重复误差为0.01%,芯-包同心度误差为0.01 μm,符合国标要求。
3.2 光纤端面非正常条件下的几何参数测量
光纤测量时,测量仪是对光纤端面进行显微放大拍照,所以对光纤端面的照明条件和切割效果都有较高的要求。当切割刀具磨损严重时,在光纤切割后,可能会光纤的端面出现毛刺或不平整,从而导致边缘在提取过程中出现大量的假边缘及干扰信号[20-21]。另外,在测量过程中若光纤端面的照明不均匀,则可能使端面的灰度值发生偏移,此时若使用灰度重心作为光纤端面的几何中心,则会使求出的光纤中心偏离真实的光纤几何中心。图 4(a)和图 4(b)为同根光纤在切割效果不佳(分两次切割)且照明条件不良时的光纤端面图。
对图 4(a)所示的光纤端面图使用FGM-5测量仪测量该光纤的几何参数,测量结果如表 3所示。
表 3. FGM-5几何参数测试仪的非正常测量数据Table 3. Deviant data of FGM-5 optical fiber geometry measurement system实验组数 包层直径/μm 包层不圆度/% 纤芯直径/μm 纤芯不圆度/% 芯-包同心度/μm 1 124.832 0.077 9.092 1.529 0.288 2 124.830 0.094 9.037 1.148 0.302 3 124.869 0.089 9.037 1.754 0.302 4 124.862 0.095 9.045 0.837 0.283 5 124.837 0.091 9.010 2.016 0.278 平均值 124.846 0.089 9.044 1.457 0.291 最大偏差 0.023 0.012 0.048 0.62 0.013 | Show TableDownLoad:
CSV
用本文方法对该光纤进行测量得到的几何参数如表 4所示。
表 4. 实测的几何参数数据Table 4. Measured fiber geometry data实验组数 包层直径/μm 包层不圆度/% 纤芯直径/μm 纤芯不圆度/% 芯-包同心度/μm 1 124.874 0.084 8.638 0.654 0.245 2 124.857 0.072 8.643 0.312 0.252 3 124.897 0.069 8.701 0.635 0.234 4 124.885 0.078 8.701 0.508 0.252 5 124.862 0.055 8.638 0.357 0.232 平均值 124.875 0.072 8.664 0.493 0.243 最大偏差 0.022 0.017 0.037 0.181 0.011 | Show TableDownLoad:
CSV
表 5列出了对图 4(b)所示光纤端面的测量结果的均值数据,并将表 1~表 4中光纤端面的几何参数均值数据与之进行综合对比。(表 5中与正常端面测量值偏差为偏差绝对值)。
表 5. 光纤几何参数均值数据对比Table 5. Comparison of mean data of optical fiber geometry实验方法 包层直径/μm 包层不圆度/% 纤芯直径/μm 纤芯不圆度/% 芯一包同心度/μm FGM-5数据 正常端面 125.096 0.110 8.420 0.670 0.238 图 4(a) 124.846 0.089 9.044 1.457 0.291 图 4(b) 125.136 0.220 9.436 2.016 0.306 与正常端面测量值偏差 图 4(a) 0.250 0.021 0.624 0.787 0.053 图 4(b) 0.040 0.110 1.016 1.346 0.068 任意椭圆函数拟合法 正常端面 125.102 0.114 8.566 0.546 0.198 图 4(a) 124.875 0.072 8.664 0.493 0.243 图 4(b) 125.104 0.052 8.804 0.553 0.270 与正常端面测量值偏差 图 4a) 0.227 0.042 0.098 0.053 0.045 图 4(b) 0.002 0.062 0.238 0.007 0.072 | Show TableDownLoad:
CSV
由表 5可以看出,当光纤的切割效果或照明条件不佳时,由FGM-5几何参数测量仪测得的数据,特别是纤芯的直径和不圆度,都出现了较大的波动,而本文方法得到的数据则较为稳定,也更接近于正常条件下的测量结果。这就是说,在测量条件变差时,本文方法测得的结果仍有很好的可信度。
4. 结论
本文提出了一种仅用任意椭圆函数单步拟合测量光纤几何参数的方法。通过对光纤端面的边缘检测提取数据点,用椭圆函数对数据点进行拟合,从根本上消除了由于圆函数与椭圆函数的分别(两步)拟合产生的中心不匹配带来的测量原理上的缺陷。利用椭圆函数拟合可以简便地同时求出光纤的长、短径与中心坐标,进而求出光纤的几何参数,改进和完善了国标GB 15972.20-2008中的光纤几何参数的测量原理。计算中由于不直接使用图像分布的灰度数据,从而能有效地减小了由于光纤端面灰度分布偏移或虚假边缘产生的测量误差。实测数据也证实,本方法在测量条件发生波动时,具有更好的测量稳定性或一致性,有利于提高仪器的测量精度。
-
图 4 非正常条件下的光纤端面图。(a)非正常端面1;(b)非正常端面2
Figure 4. Fiber end face image under improper conditions. (a) End face1; (b) End face2
表 1 FGM-5几何参数测试仪的正常测量数据
Table 1. Standard data of FGM-5 optical fiber geometry measurement system
实验组数 包层直径/μm 包层不圆度/% 纤芯直径/μm 纤芯不圆度/% 芯-包同心度/μm 1 125.073 0.116 8.421 0.865 0.241 2 125.094 0.117 8.409 0.335 0.236 3 125.120 0.118 8.431 0.666 0.246 4 125.101 0.098 8.449 0.616 0.247 5 125.093 0.102 8.388 0.868 0.221 平均值 125.096 0.110 8.420 0.670 0.238 最大偏差 0.024 0.012 0.032 0.335 0.017
下载: 导出CSV
表 2 实测的几何参数数据
Table 2. Measured fiber geometry data
实验组数 包层直径/μm 包层不圆度/% 纤芯直径/μm 纤芯不圆度/% 芯-包同心度/μm 1 125.081 0.108 8.589 0.465 0.210 2 125.101 0.114 8.551 0.208 0.191 3 125.125 0.111 8.575 0.751 0.198 4 125.108 0.122 8.583 0.862 0.188 5 125.097 0.114 8.532 0.446 0.201 平均值 125.102 0.114 8.566 0.546 0.198 最大偏差 0.023 0.008 0.034 0.338 0.012
下载: 导出CSV
表 3 FGM-5几何参数测试仪的非正常测量数据
Table 3. Deviant data of FGM-5 optical fiber geometry measurement system
实验组数 包层直径/μm 包层不圆度/% 纤芯直径/μm 纤芯不圆度/% 芯-包同心度/μm 1 124.832 0.077 9.092 1.529 0.288 2 124.830 0.094 9.037 1.148 0.302 3 124.869 0.089 9.037 1.754 0.302 4 124.862 0.095 9.045 0.837 0.283 5 124.837 0.091 9.010 2.016 0.278 平均值 124.846 0.089 9.044 1.457 0.291 最大偏差 0.023 0.012 0.048 0.62 0.013
下载: 导出CSV
表 4 实测的几何参数数据
Table 4. Measured fiber geometry data
实验组数 包层直径/μm 包层不圆度/% 纤芯直径/μm 纤芯不圆度/% 芯-包同心度/μm 1 124.874 0.084 8.638 0.654 0.245 2 124.857 0.072 8.643 0.312 0.252 3 124.897 0.069 8.701 0.635 0.234 4 124.885 0.078 8.701 0.508 0.252 5 124.862 0.055 8.638 0.357 0.232 平均值 124.875 0.072 8.664 0.493 0.243 最大偏差 0.022 0.017 0.037 0.181 0.011
下载: 导出CSV
表 5 光纤几何参数均值数据对比
Table 5. Comparison of mean data of optical fiber geometry
实验方法 包层直径/μm 包层不圆度/% 纤芯直径/μm 纤芯不圆度/% 芯一包同心度/μm FGM-5数据 正常端面 125.096 0.110 8.420 0.670 0.238 图 4(a) 124.846 0.089 9.044 1.457 0.291 图 4(b) 125.136 0.220 9.436 2.016 0.306 与正常端面测量值偏差 图 4(a) 0.250 0.021 0.624 0.787 0.053 图 4(b) 0.040 0.110 1.016 1.346 0.068 任意椭圆函数拟合法 正常端面 125.102 0.114 8.566 0.546 0.198 图 4(a) 124.875 0.072 8.664 0.493 0.243 图 4(b) 125.104 0.052 8.804 0.553 0.270 与正常端面测量值偏差 图 4a) 0.227 0.042 0.098 0.053 0.045 图 4(b) 0.002 0.062 0.238 0.007 0.072
下载: 导出CSV
-
[1] 中华人民共和国国家质量监督检验检疫总局, 中国国家标准化管理委员会.光纤试验方法规范第20部分: 尺寸参数的测量方法和试验程序光纤几何参数: GB 15972.20–2008[S].北京: 中国标准出版社, 2008.
General Administration of Quality Supervision, Inspection and Quarantine of the People's Republic of China, Standardization Administration of the People's Republic of China. Specifications for optical fibre test methods-part 20: measurement methods and test procedures for dimensions- fiber geometry: GB 15972.20–2008[S]. Beijing: Standards Press of China, 2008.
[2] 陈磊, 陈进榜, 陆润华.光纤几何参数的自动检测仪[J].光学学报, 2001, 21(10): 1245–1248. doi: 10.3321/j.issn:0253-2239.2001.10.021
Chen L, Chen J B, Lu R H. Automatic measurement of optical fiber geometric parameters[J]. Acta Optica Sinica, 2001, 21(10): 1245–1248. doi: 10.3321/j.issn:0253-2239.2001.10.021
[3] 殷爱娥, 姜仲玄, 张一龙.光纤折射率剖面的折射近场法测量的研究[J].光学学报, 1989, 9(2): 181–185. doi: 10.3321/j.issn:0253-2239.1989.02.014
Yin A E, Jiang Z X, Zhang Y L. Refracted near-field technique for the measurement of optical fiber refractive index profiles[J]. Acta Optica Sinica, 1989, 9(2): 181–185. doi: 10.3321/j.issn:0253-2239.1989.02.014
[4] 高迎春.基于折射近场法测量光纤折射率分布的仿真研究[D].哈尔滨: 哈尔滨工程大学, 2012.
Gao Y C. Simulation of measuring the optical fiber refractive index profiles by refraction near-field method[D]. Harbin: Harbin Engineering University, 2012.
[5] 孙会刚, 储九荣, 钟力生, 等.塑料光纤折射率分布的测量方法[J].光纤与电缆及其应用技术, 2001(4): 12–16. doi: 10.3969/j.issn.1006-1908.2001.04.004
Sun H G, Chu J R, Zhong L S, et al. Measurement of refractive-index profile of plastic optical fibers[J]. Optical Fiber & Electric Cable, 2001(4): 12–16. doi: 10.3969/j.issn.1006-1908.2001.04.004
[6] 贾宏志, 李育林, 忽满利.光纤光栅的制作方法[J].激光技术, 2001, 25(1): 23–26. doi: 10.3969/j.issn.1001-3806.2001.01.001
Jia H Z, Li Y L, Hu M L. Fabrication methods of fiber gratings[J]. Laser Technology, 2001, 25(1): 23–26. doi: 10.3969/j.issn.1001-3806.2001.01.001
[7] 武志宏.基于CCD和图像处理技术的六角光纤几何尺寸测量系统的研究[D].太原: 太原理工大学, 2006.
Wu Z H. The research about measurement system of six-angle fiber geometrical dimension on the basis of CCD and image processing[D]. Taiyuan: Taiyuan University of Technology, 2006.
[8] 马利东.光子晶体光纤有效模面积测量技术的研究[D].秦皇岛: 燕山大学, 2016.
Ma L D. Research on effective mode area measurement of photonic crystal fiber[D]. Qinhuangdao: Yanshan University, 2016.
[9] Hameed M F O, Obayya S S A. Modal analysis of a novel soft glass photonic crystal fiber with liquid crystal core[J]. Journal of Lightwave Technology, 2012, 30(1): 96–102. doi: 10.1109/JLT.2011.2175436
[10] Rosa L, Coscelli E, Poli F, et al. Thermal modeling of gain competition in Yb-doped large-mode-area photonic-crystal fiber amplifier[J]. Optics Express, 2015, 23(14): 18638–18644. doi: 10.1364/OE.23.018638
[11] 杨远.基于机器视觉的光纤几何参数检测研究[D].哈尔滨: 哈尔滨工程大学, 2011.
Yang Y. Research on detecting optical fiber geometric parameter based on machine vision[D]. Harbin: Harbin Engineering University, 2011.
[12] 凌凤彩, 康牧, 林晓.改进的Canny边缘检测算法[J].计算机科学, 2016, 43(8): 309–312. doi: 10.11896/j.issn.1002-137X.2016.8.063
Ling F C, Kang M, Lin X. Improved Canny edge detection algorithm[J]. Computer Science, 2016, 43(8): 309–312. doi: 10.11896/j.issn.1002-137X.2016.8.063
[13] 郭萌, 胡辽林, 赵江涛.基于Kirsch和Canny算子的陶瓷碗表面缺陷检测方法[J].光学学报, 2016, 36(9): 0904001. doi: 10.3788/aos201636.0904001
Guo M, Hu L L, Zhao J T. Surface defect detection method of ceramic bowl based on Kirsch and Canny operator[J]. Acta Optica Sinica, 2016, 36(9): 0904001. doi: 10.3788/aos201636.0904001
[14] 王文豪, 姜明新, 赵文东.基于Canny算子改进的边缘检测算法[J].中国科技论文, 2017, 12(8): 910–915. doi: 10.3969/j.issn.2095-2783.2017.08.013
Wang W H, Jiang M X, Zhao W D. Edge detection algorithm based on improved Canny operator[J]. China Sciencepaper, 2017, 12(8): 910–915. doi: 10.3969/j.issn.2095-2783.2017.08.013
[15] 王万国, 王仕荣, 徐正飞, 等.基于边界的最小二乘椭圆拟合改进算法[J].计算机技术与发展, 2013, 23(4): 67–70. doi: 10.3969/j.issn.1673-629X.2013.04.016
Wang W G, Wang S R, Xu Z F, et al. Optimal ellipse fitting algorithm of least square principle based on boundary[J]. Computer Technology and Development, 2013, 23(4): 67–70. doi: 10.3969/j.issn.1673-629X.2013.04.016
[16] 熊风光, 李希, 韩燮.基于整体最小二乘的椭圆拟合方法[J].微电子学与计算机, 2017, 34(1): 102–105. http://d.old.wanfangdata.com.cn/Periodical/wdzxyjsj201701022
Xiong F G, Li X, Han X. A method of ellipse fitting based on total least squares[J]. Microelectronics & Computer, 2017, 34(1): 102–105. http://d.old.wanfangdata.com.cn/Periodical/wdzxyjsj201701022
[17] 曹俊丽, 李居峰.基于莱特准则的椭圆拟合优化算法[J].计算机应用, 2017, 37(1): 273–277. doi: 10.11772/j.issn.1001-9081.2017.01.0273
Cao J L, Li J F. Improved ellipse fitting algorithm based on Letts criterion[J]. Journal of Computer Applications, 2017, 37(1): 273–277. doi: 10.11772/j.issn.1001-9081.2017.01.0273
[18] Gander W, Golub G H, Strebel R. Least–squares fitting of circles and ellipses[J]. BIT Numerical Mathematics, 1994, 34(4): 558–578. doi: 10.1007/BF01934268
[19] Mitchell D R G, Van den Berg J A. Development of an ellipse fitting method with which to analyse selected area electron diffraction patterns[J]. Ultramicroscopy, 2016, 160: 140–145. doi: 10.1016/j.ultramic.2015.10.009
[20] 何晨程, 杨婧, 宋海燕, 等.切割刀老化对单模光纤几何尺寸检测结果的影响[J].现代传输, 2016(1): 56–61. doi: 10.3969/j.issn.1673-5137.2016.01.001
He C C, Yang J, Song H Y, et al. Effect of cutting tool aging on the geometric size measurement of single mode fiber[J]. Modern Transmission, 2016(1): 56–61. doi: 10.3969/j.issn.1673-5137.2016.01.001
[21] 刘为, 唐春晖, 马秀梅, 等.缺陷光纤端面几何参数的测量[J].光通信研究, 2013, 39(6): 35–38. doi: 10.3969/j.issn.1005-8788.2013.06.011
Liu W, Tang C H, Ma X M, et al. Measurement of geometric parameters of defective fiber ends[J]. Study on Optical Communications, 2013, 39(6): 35–38. doi: 10.3969/j.issn.1005-8788.2013.06.011
期刊类型引用(2)
1. 金柯,陈晓荣. 基于机器视觉的光纤端面几何参数测量研究. 计量学报. 2023(02): 165-170 .  百度学术
百度学术
2. 李一鸣,涂建坤,项华中,江斌,郑刚. 光纤灰度分布的高斯函数拟合法测量光纤几何参数. 光电工程. 2020(04): 34-41 . 本站查看
其他类型引用(1)
-


 点击扫一扫
点击扫一扫
图(6)
表(5)
计量
- 文章访问数: 9252
- PDF下载数: 2394
- 施引文献: 3